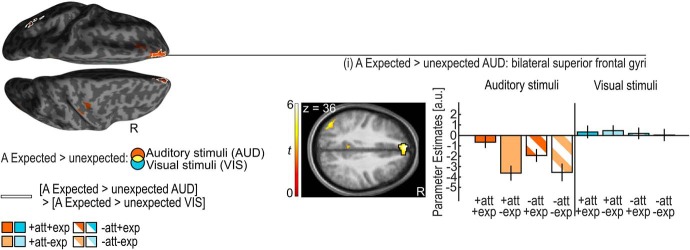
Figure 3.
Auditory (A) expected > unexpected for auditory and visual stimuli. Activation increases for A expected > unexpected auditory stimuli (orange) are rendered on an inflated canonical brain; they are encircled in white if they are significantly greater for auditory than visual stimuli (i.e., interaction). Height threshold of p < 0.001, uncorrected; extent threshold k > 0 voxels. Bar plots show the parameter estimates (across participants mean ± SEM, averaged across all voxels in the black encircled cluster) in the medial prefrontal cortices (i.e., anterior portions of the superior frontal gyri) that are displayed on axial slices of a mean image created by averaging the subjects' normalized structural images; the bar graphs represent the size of the effect in non-dimensional units (corresponding to percentage whole-brain mean). Audition: orange; vision: blue; attended: full pattern; unattended: striped pattern; expected: dark shade; unexpected: light shade.

