
Figure 5.
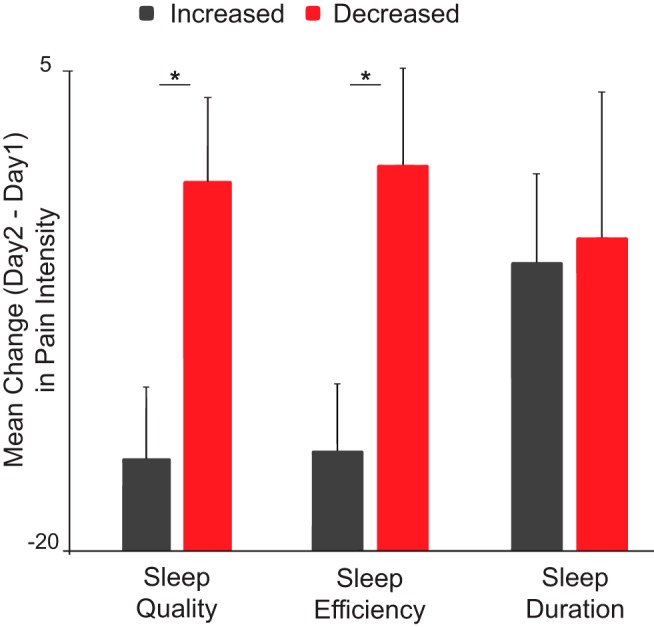
Online study results. Data are mean ± SD. Bar graph represents participants experiencing a decrease (red bar) or increase (black) in measures of sleep efficiency (SE) (Night 2 to Night 1 mean decreased SE = −3.8 ± 5.6%; Night 2 to Night 1 mean increased SE = 10.1 ± 11.1%), quality (SQ) (Night 2 to Night 1 mean decreased SQ = −0.48 ± 0.75; Night 2 to Night 1 mean increased SQ = 1.7 ± 0.81), and duration (Night 2 to Night 1 mean decreased duration = −54.375 ± 45.7 min; Night 2 to Night 1 mean increased duration = 90.7 ± 48.9 min). Error bars indicate SEM. Each point represents a single-subject's change in reported pain from day 1 to day 2. Night-to-night decreases in sleep efficiency and quality, but not duration, resulted in corresponding higher pain from one day to the next, relative to those with night-to-night increases in these sleep measures. *p < 0.05.