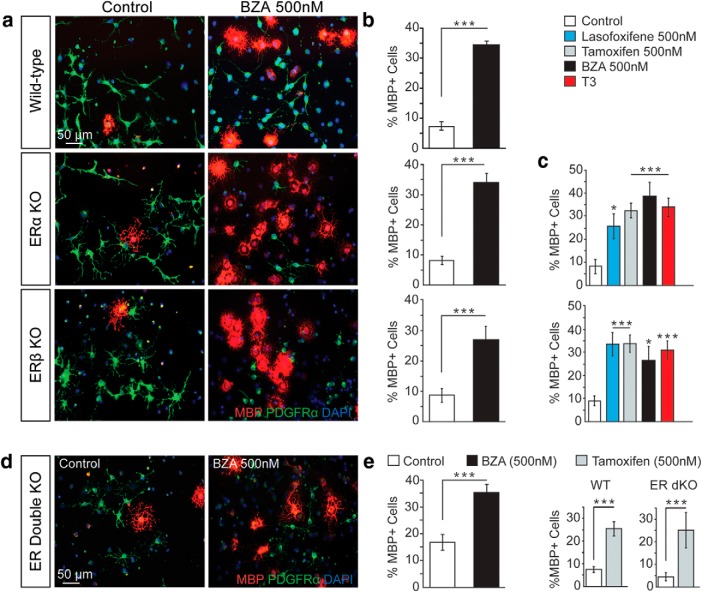
Figure 4.
BZA enhances OPC differentiation independently of the ER a, Representative images of control and BZA-treated (500 nm) WT, ERα, and ERβ KO OPCs, treated for 2 d and immunostained for MBP (red) and PDGFRα (green). Cell nuclei are shown by DAPI (blue). b, Quantification of MBP+ cells over total cells in WT, ERα, and ERβ KO OPC cultures treated with control or BZA (500 nm). c, Quantification of MBP+ cells over total cells in ERα and ERβ KO OPC cultures treated with various SERMs (500 nm), as well as the positive control T3 (1×). d, Representative images of control and BZA-treated (500 nm) OPCs from ERα and ERβ DKO animals treated for 2 d and immunostained for MBP (red) and PDGFRα (green). Cell nuclei are shown by DAPI (blue). e, Quantification of MBP+ cells over total cells (DAPI+ nuclei) in ER-DKO OPC cultures of BZA- and tamoxifen (500 nm)-treated groups. For all quantifications, error bars indicate SEM. *p < 0.05, ***p < 0.001. For all experiments, n = 3 temporally separate trials and n > 3 coverslips per group per trial.

