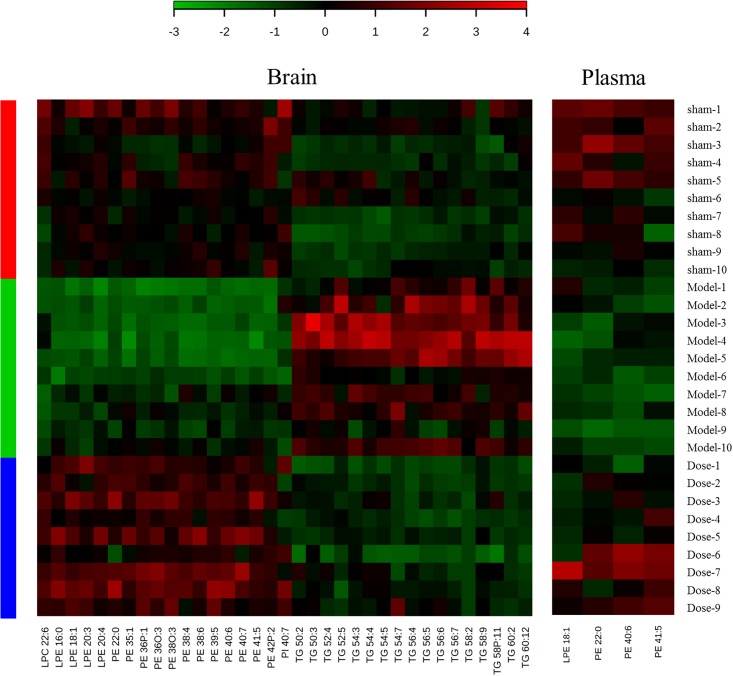
FIGURE 3.
Heat maps of potential biomarkers with return tendency. The abscissa is the compound name, and the ordinate is the number of animals. Groups are listed on the left: red is the sham operation group, green is the model group, and blue is the dosed model group. Green patches represent a decrease, and red patches represent an increase. The color reference is provided by the scale bar at the top.

