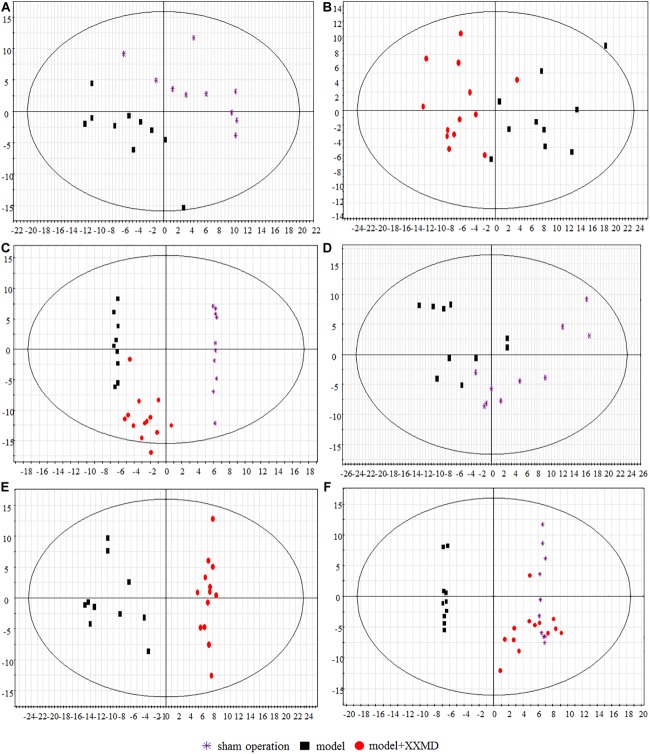
FIGURE 4.
Score scatter plots of lipids by PCA and T-prediction by OPLS-DA. (A) PCA, model group and sham operation group with respect to plasma. (B) PCA, dosed model group and model group with respect to plasma. (C) OPLS-DA, T predicted score scatter plots of the dosed model group with respect to plasma. (D) PCA, model group and sham operation group with respect to brain tissue. (E) PCA, dosed model group and model group with respect to brain tissue. (F) OPLS-DA, T predicted score scatter plots of the dosed model group with respect to brain tissue.

