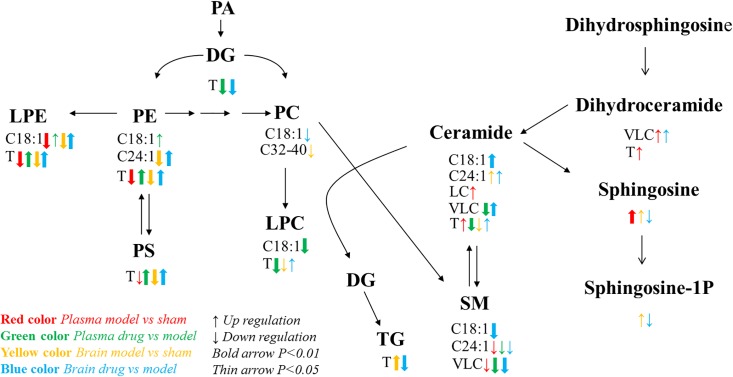
FIGURE 5.
Lipid metabolic network and the variation tendency. Red arrows represent the comparison between the sham operation and model groups with respect to plasma; green arrows represent the comparison between the dosed model and model groups; yellow arrows represent the comparison between the sham operation and model groups with respect to brain tissue; blue arrows represent the comparison between the dosed model and model groups. Up arrows indicate an increase, and down arrows indicate a decrease. C18:1 indicates lipids with an 18:1 acyl chain; C24:1 indicates lipids with a 24:1 acyl chain; LC refers to long acyl chain lipids (≤20°C); and VLC refers to very long acyl chain lipids (≥20°C). T means total content.

