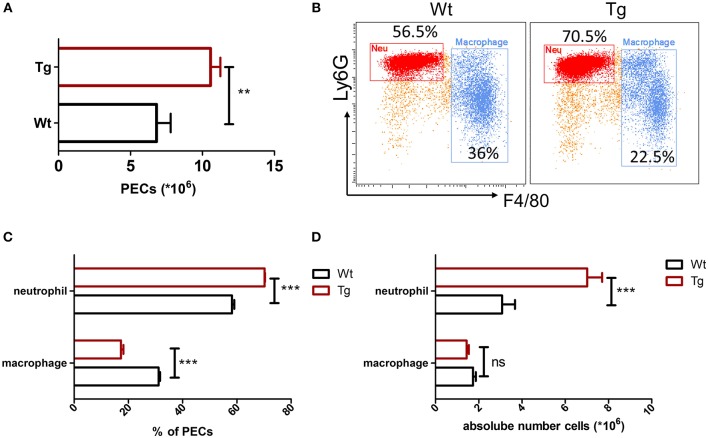
Figure 1.
Increased neutrophil recruitment in α2BAR-Tg mice after MSU stimulation. Wt and α2BAR-Tg mice were treated with MSU to induce peritonitis. After 6 h, the total PECs were harvested. (A) Quantitative analysis of total number of PECs. (B) The PECs were stained with anti-CD11b, anti-F4/80, and anti-Ly6G antibodies. CD11b+ cells were gated for the analysis of macrophage (CD11b+Ly6G−F4/80+) and neutrophil (CD11b+Ly6G+F4/80−). Representative images were shown. (C) Statistical bar graph showing the percentages of macrophages and neutrophils in total CD11b+ cells. (D) The absolute numbers of neutrophils and macrophages in PECs. Data are represented as mean ± SEM (n = 6–8/group). The results shown are from one of three independent experiments. **p < 0.01, ***p < 0.001. ns, not significant.

