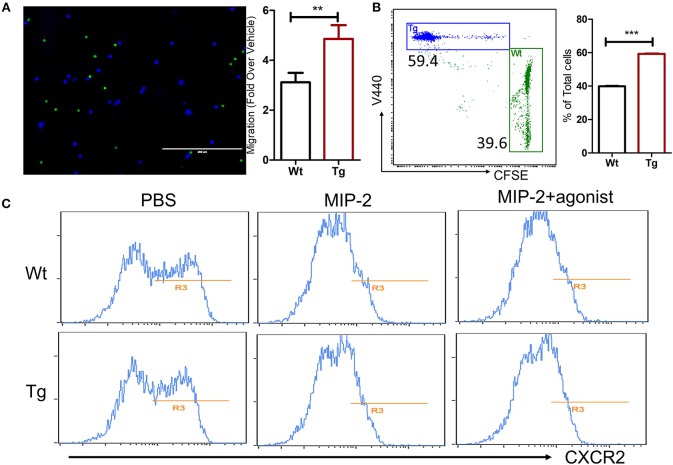
Figure 6.
α2BAR overexpression enhances in vitro neutrophils migration. Neutrophils were isolated from α2BAR-Tg and Wt bone marrows and stained with V440 (blue) and CFSE (green), respectively. Labeled cells were mixed at 1:1 ration and used for the Transwell® migration assay in response to MIP2. (A) Upper panel, Representative fluorescent microscopic image showing α2BAR-Tg (Blue) and Wt (Green) neutrophils migrating through the membrane. Lower panel, quantitative analysis showing the migration of α2BAR-Tg and Wt neutrophils. (B) Representative dot plot (upper panel) and quantitative analysis (lower panel) showing the percentages of V440-labeled cells (α2BAR-Tg) and CFSE-labeled cells (Wt) in the bottom well of the Transwell® plate. (C) The Cxcr2 expressions on bone marrows neutrophil with or without treatment of MIP-2 or MIP-2 plus α2BAR agonist clonidine hydrochloride were analyzed by flow cytometry. Data shown are representative of 3 independent experiments. **p < 0.01, ***p < 0.001.

