Figure 6.
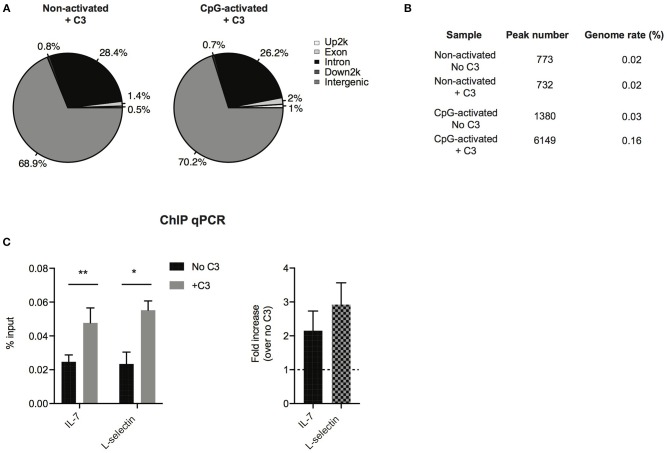
Confirmation of C3-DNA interaction by ChIP sequencing. (A) ChIP-seq identified peaks from anti-C3 immunoprecipitated chromatin samples were classified based on the location (UCSC annotation data) and are shown in the following genome regions: intergenic, introns, downstream 5 Kbp, upstream 5 Kbp, and exons. The interacting DNA elements localized mainly the intergenic and intronic regions. (B) ChIP-seq statistics of identified peaks including peak numbers and genome rate (%). C3 binding to genomic DNA is strongly increased upon stimulation of B cells with the polyclonal activator, CpG oligonucleotide. (C) ChIP-PCR was run on ChIP DNA of CpG-activated samples using primers specific for the ChIP-seq identified regions in IL-7 and L-selectin genes. Enrichment of the specific DNA loci was calculated with the percent input method and illustrated as % input or as fold changes over samples without C3 treatment (two-way ANOVA with Sidak's multiple comparison, *p < 0.05, **p < 0.01). The values represent the mean ± SEM of four independent experiments.

