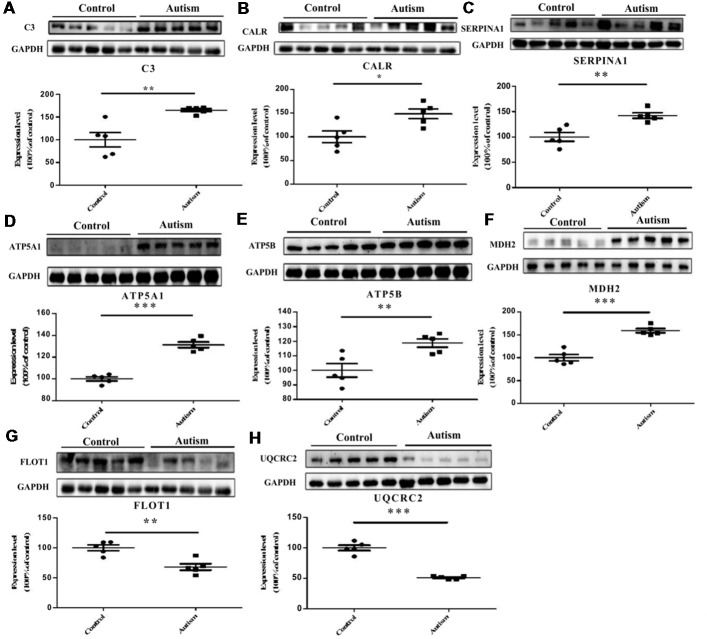
Figure 6.
Validation of differentially expressed proteins in PBMCs of children with autism by Western blot analysis. (A) Complement C3 (C3). (B) Calreticulin (CALR). (C) Alpha-1-antitrypsin (SERPINA1). (D) ATP synthase subunit alpha, mitochondrial (ATP5A1). (E) ATP synthase subunit beta, mitochondrial (ATP5B). (F) Malate dehydrogenase, mitochondrial (MDH2). (G) Flotillin-1 (FLOT1). (H) Cytochrome b-c1 complex subunit 2, mitochondrial (UQCRC2). The level of protein expression is normalized with the mean of the controls (n = 5), with each bar representing the standard deviation (SD; P < 0.05). The upper images of Western blot analysis correspond to the lower histograms of semiquantification. *P < 0.05, **P < 0.01, ***P < 0.001.

