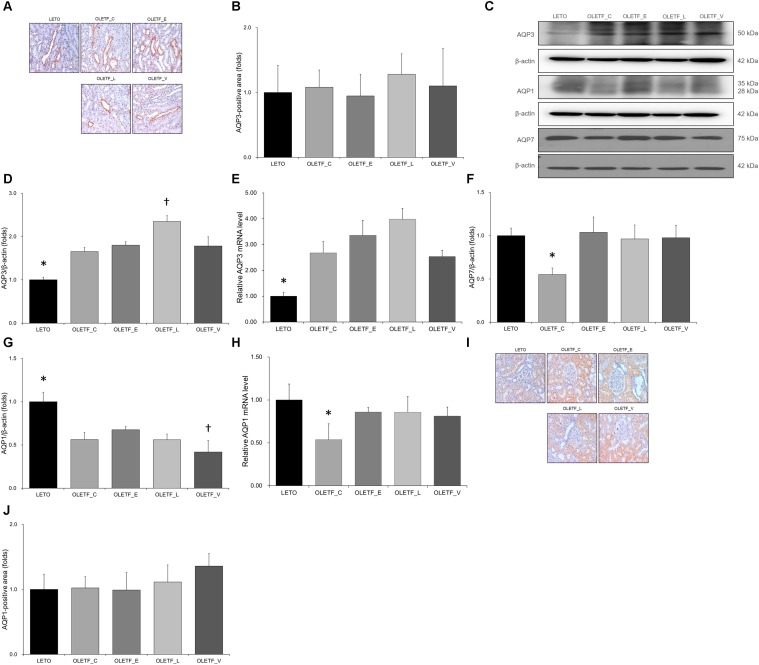
FIGURE 5.
Empagliflozin causes no significant changes to AQP3 and AQP1 but tends to increase AQP7 level in diabetic rat kidneys. (A) Representative renal sections immunostained with anti-AQP3. (B) Quantitative analysis of results for AQP3 shows no significant change among groups. Magnification, ×200. (C) Representative immunoblot reacting with anti-NCC, anti-α-ENaC and anti- γ-ENaC. (D) Densitometric analysis shows that the expression of AQP3 protein significantly increased in all OLETF rats. Lixisenatide treatment further increased the expression of AQP3. ∗P < 0.001 vs. other groups. †P < 0.001 vs. OLETF_C; P = 0.002 vs. OLETF_E; P = 0.003 vs. OLETF_V. (E) qRT-PCR shows that mRNA level of AQP3 significantly increased in all OLETF rats. ∗P = 0.001 vs. OLETF_C; P < 0.001 vs. OLETF_E and OLETF_L; P = 0.001 vs. OLETF_V. (F) Densitometric analysis shows that AQP7 in kidneys was significantly lower in untreated OLETF group than in LETO group and all treated OLETF groups. ∗P < 0.001 vs. LETO and OLETF_E; P = 0.001 vs. OLETF_L and OLETF_V. (G) Densitometric analysis shows the decreased AQP1 expressions in all OLETF rats. ∗P < 0.001 vs. other groups. †P = 0.046 vs. OLETF_C; P < 0.001 vs. OLETF_E; P = 0.047 vs. OLETF_L (H) mRNA level of AQP1, decreased in untreated OLETF rats, was increased with antidiabetic treatment. ∗P < 0.001 vs. LETO; P = 0.003 vs. OLETF_E; P = 0.001 vs. OLETF_L; P = 0.002 vs. OLETF_V. (I) Representative renal sections immunostained with anti-AQP1. (J) Quantitative analysis of results for AQP1 shows no significant changes among groups. Magnification, ×200. n = 8 per each group.

