Figure 1.
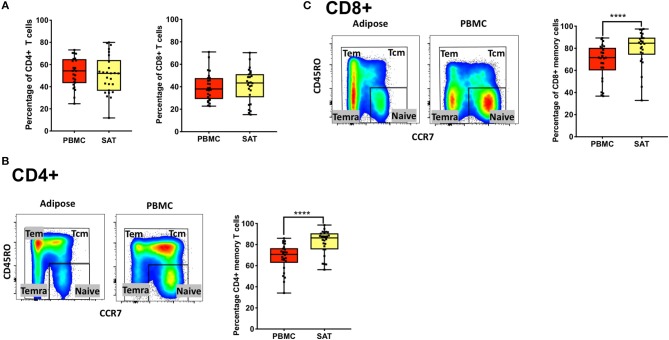
Subcutaneous adipose tissue from PLWH has a higher percentage of CD4+ and CD8+ memory T cells compared to matched blood samples. (A) Frequencies of total CD4+ and CD8+ T cells (percentage of CD3+ cells) in subcutaneous adipose tissue (SAT) and blood (PBMC) from all 26 PLWH. (B) Representative plot showing gating of CD4+ memory T cells (gated on CD3+) in SAT and PBMC depicted by the yellow and red shading, respectively; on the right are individual values and means. (C) Representative plot showing total CD8+ memory T cells in adipose tissue and PBMC. The box and whiskers plot indicate mean ± SD. Wilcoxon matched pair signed test was used to calculate statistics (A-C); ****p < 0.0001.

