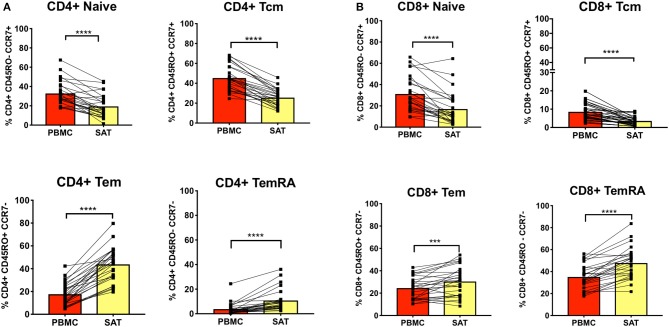
Figure 2.
Subcutaneous adipose tissue has a higher percentage of TEM (CD45RO+ CCR7−) and TEMRA (CD45RO− CCR7−) cells compared to blood in PLWH. (A) The bar graphs show frequencies of CD4+ TNai, TEM, TCM, and TEMRA cells in subcutaneous adipose tissue (SAT) and blood (PBMC) from all twenty-six subjects. (B) Frequencies of CD8+ TNai, TEM, TCM, and TEMRA cells in SAT and PBMC. The numbers in the bar graphs on the left indicate mean and diagonal lines indicate matched pairs of SAT and PBMCs. Wilcoxon matched pair signed test was used to calculate statistics ****p < 0.0001; ***p < 0.001.

