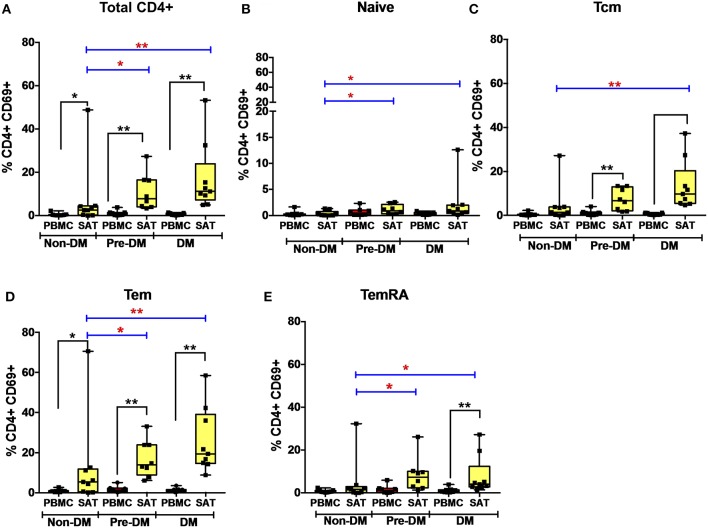
Figure 4.
CD69 expression on subcutaneous adipose tissue CD4+ T cells increases with progressive glucose intolerance. (A–E) Frequencies of CD4+ total T cells, TNai, TCM, TEM, and TEMRA cells expressing the CD69 activation and putative tissue-residence marker in subcutaneous adipose tissue (SAT) and blood (PBMC). The box and whiskers plot indicate mean ± SD. Wilcoxon matched-pair rank test was used to calculate differences between PBMC and SAT. Mann-Whitney test used to calculate differences between groups; blue lines and red * depict differences between groups **p < 0.01, *p < 0.05.

