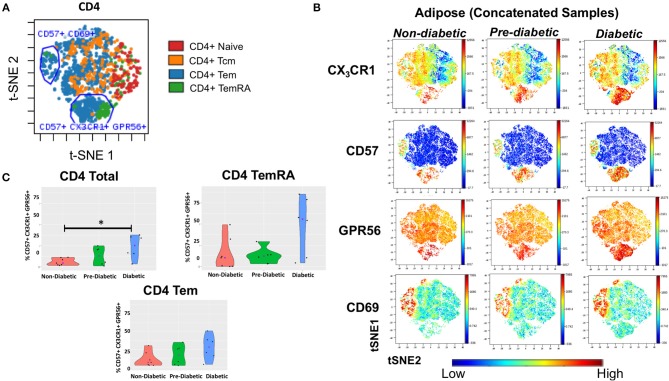
Figure 5.
CD4+ T cells co-expressing CD57, CX3CR1, GPR56 in subcutaneous adipose tissue increase with progressive glucose intolerance. viSNE plots were generated in cytobank to identify groups of cells that differ between non-diabetic, pre-diabetic and diabetic categories. (A) Clusters of CD4+, TNai, TEM, TCM, and TEMRA cells from subcutaneous adipose tissue (SAT). (B) Concatenated viSNE plots of non-diabetic, pre-diabetic, and diabetic PLWH showing clusters of cells expressing CX3CR1, CD57, GPR56, and CD69. (C) Violin plots showing percentage of total CD4+, TEM, and TEMRA cells co-expressing CD57, CX3CR1, and GPR56. Mann-Whitney test used to analyze differences between metabolic groups; *P < 0.05.

