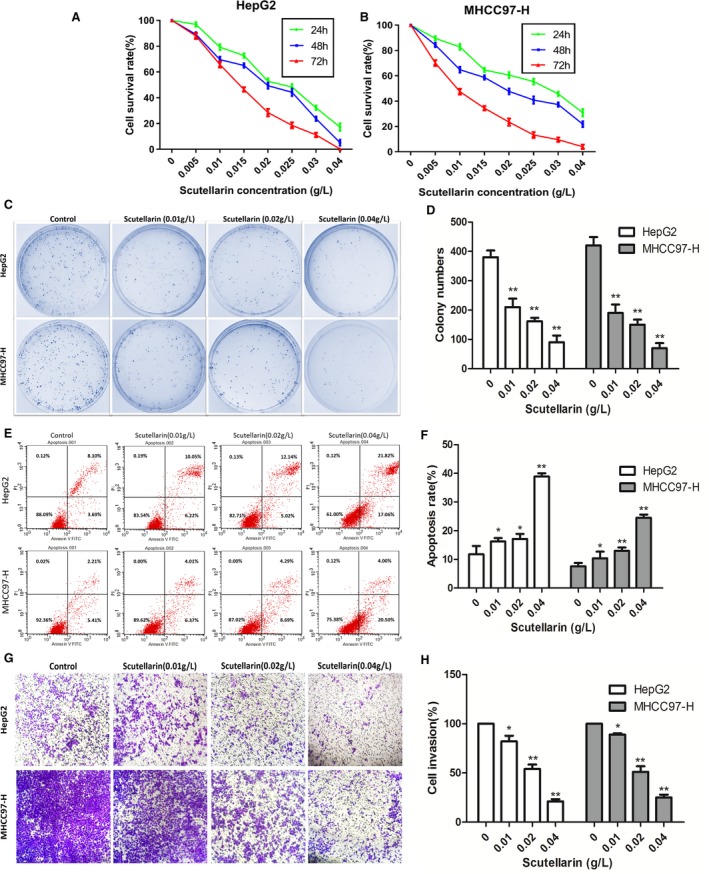
Figure 1.

The effect of scutellarin exerted on hepatocellular carcinoma cells. A, HepG2 cell viability was measured by MTT assay. B, MHCC97‐H Cell viability was measured by MTT assay. Values were represented as mean ± SD of three independent experiments performed in triplicate. C, Cell colony‐forming capacity was measured by Plate colony‐forming assay. Colony formation was photographed and counted under a 100× magnification. D, Quantification of colony‐forming assay. E, Cell apoptosis was detected by flow cytometry. F, Quantification of apoptosis assay. G, Cell invasion ability was assessed by transwell invasion assay. H, Quantification of invasion assay. *P < 0.05 and **P < 0.01 compared with the control group. Data are presented as the mean ± SD of three separate experiments. SD: standard deviation
