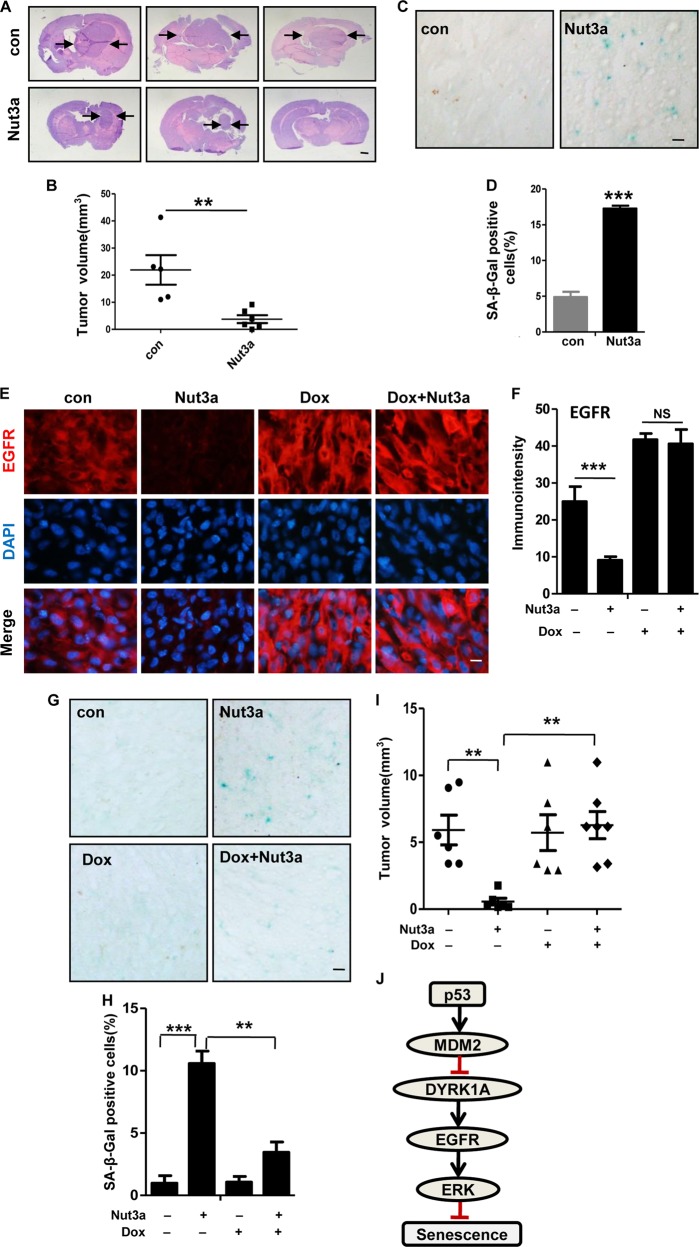
Fig. 7. Induction of senescence by p53 activation is mediated by EGFR in vivo.
a–d U87 cells were inoculated into the right striatum of mouse brain (n = 5–6 per group). At day 5, 40 mg/kg Nut3a were intraperitoneally injected into mice every other day, on day 28, all mice were euthanized. Brains were fixed, frozen, and systematically sectioned throughout the tumor injection site. Frozen sections (7 μm) were obtained and immunochemical staining was performed. a Representative pictures of hematoxylin–eosin staining of tumor sections from mice of two groups (×10). Arrows show the edge of tumor. Scale bar, 1 mm. b Tumor volumes were calculated and Nut3a-administered mice exhibited decreased tumor volumes. c Representative images showed the positive senescence-associated β-galactosidase (SA-β-gal) staining of tumor sections from Nut3a-administered mice (×400). Scale bar, 20 μm. d Quantitative summary of senescent cells was analyzed by the ImageJ software. e–i U87 pLVX-TRE 3G-EGFR (epidermal growth factor receptor) cells were inoculated into the right striatum of mouse brain (n = 6–7 per group).To induce the expression of EGFR, 1.2 mg/mL of doxycycline administered in 5% sucrose-containing drinking water can be used every day. At day 5, 40 mg/kg Nut3a were intraperitoneally injected into mice every other day, and on day 26, all mice were euthanized. e Representative immunofluorescence (IF) images showing the expression of EGFR (×400). Scale bar, 10 μm. f Quantitative immunointensity of EGFR was analyzed by the ImageJ software. g, h Overexpression of EGFR attenuates Nut3a-induced senescence. g Representative images showed the positive SA-β-gal staining of tumor sections. Scale bar, 20 μm. h Quantitative summary of senescent cells was analyzed by the ImageJ software. i Tumor volumes were calculated for hematoxylin–eosin staining of tumor sections from mice of four groups. j Schematic model of signaling pathways in Nut3a-induced cell senescence. **p < 0.01, ***p < 0.001 vs. control. NS not significant

