Figure 5.
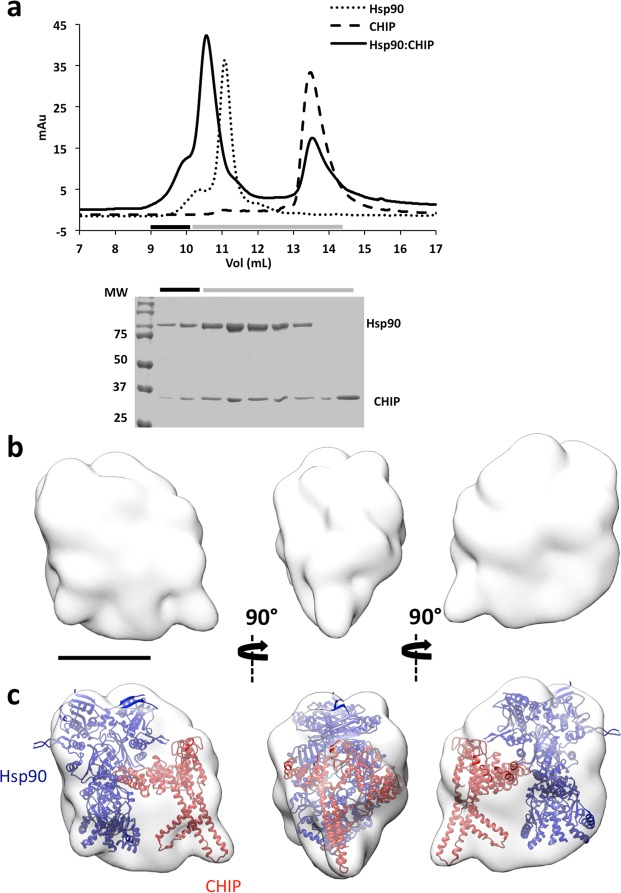
Isolation and structural characterisation of the Hsp90:CHIP complex. (a) Top, size-exclusion profile of the complex (continuous line) compared with the profiles for Hsp90 (dotted line) and p53-TMGST (broken line). Bottom, the selected fractions were analysed by SDS-PAGE and stained with Coomassie Blue. (b) Three orthogonal views of the Hsp90:p53-TMGST complex 3D reconstruction. (c) The same views, with docking of Hsp90 and CHIP. Bar, 100 Å for (b,c).

