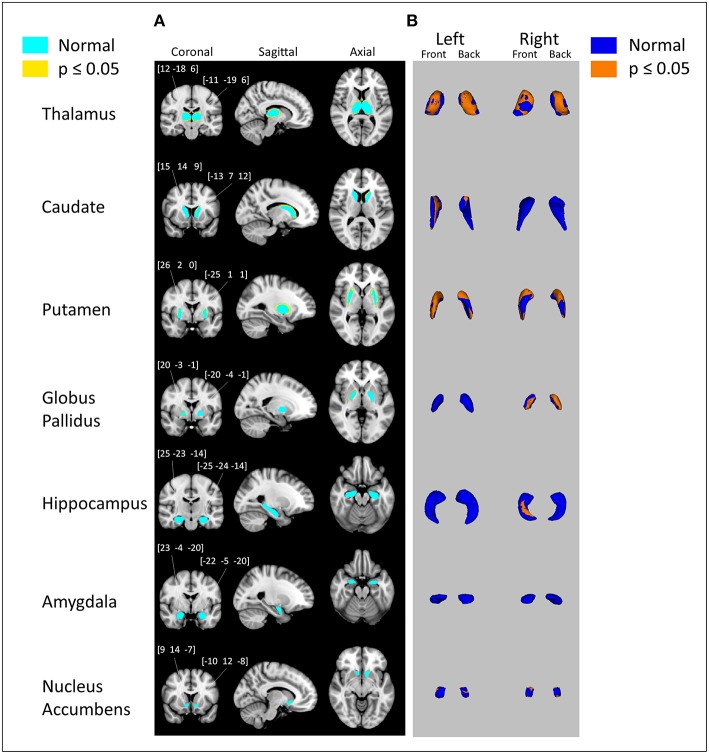
Figure 2.
Subcortical surface alterations in thalamus, caudate, putamen, globus pallidus, hippocampus, amygdala, and nucleus accumbens. Vertex analysis adjusted for age, total brain volume; p = 0.05 (FDR corrected). (A) Coronal, sagittal, and axial views of the results of vertex analysis. Regions in light blue represent the original subcortical structure. Regions in yellow and orange represent the outlines of where volumetric reduction occurred. Numbers above coronal views of subcortical structures represent the MNI coordinates of right and left subcortical structures (B) 3D rendering of the results of vertex analysis. Blue models represent the original subcortical structure. Orange layers represent the locations where volumetric reduction occurred.

