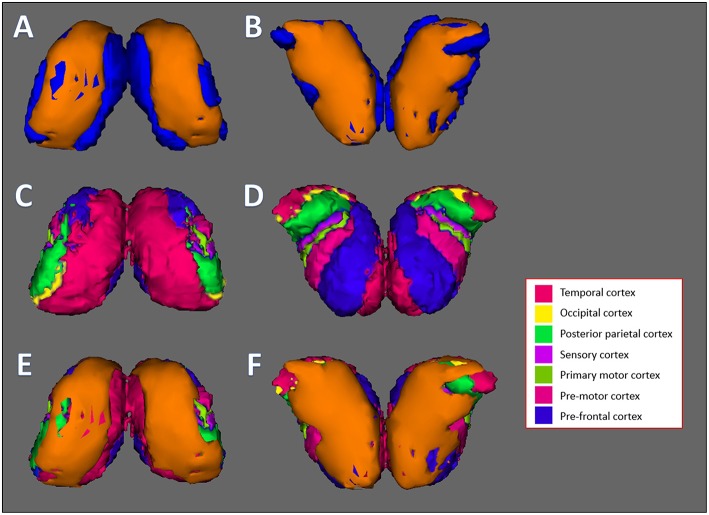
Figure 4.
Thalamus vertex analysis overlaid on top of Oxford thalamic connectivity subfields generated by FSL. (A,B) Front and back results of FSL's vertex analysis of the thalamus. The orange layer represents the surface where significant reduction of the thalamus occurred. The blue layer represents the original thalamus structure. (C,D) The Oxford Thalamic Connectivity Atlas. Each thalamic subfield is represented by a color: Temporal cortex, magenta; occipital cortex, yellow; posterior parietal cortex, green; sensory cortex, purple; primary motor cortex, dark green; pre-motor cortex, pink; pre-frontal cortex, blue. (E,F) Front and back results of thalamus vertex analysis, represented by the orange layer, overlaid on top of the Oxford Thalamic Connectivity subfields. Every substructure was overlapped by thalamus vertex analysis layer. (A,C,E) represent the front side of the bilateral thalamus while (B,D,F) represent the back side.

