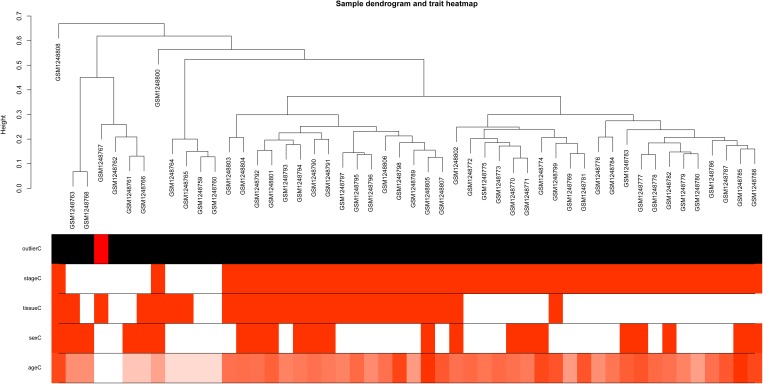
FIGURE 1.
Sample dendrogram and trait heatmap. The leaves of the tree correspond to osteoarthritis (OA) samples and non-steoarthritis (non-OA) samples. The first color band underneath the tree indicates which arrays appear to be outlying. The second color band represents disease stages which indicate OA and non-OA (red indicates high values). The third color band represents tissue sources which indicate samples from knee lateral tibial (LT) and medial tibial (MT) (red indicates high values). Similarly, the remaining color-bands color-code the numeric values of physiologic traits.

