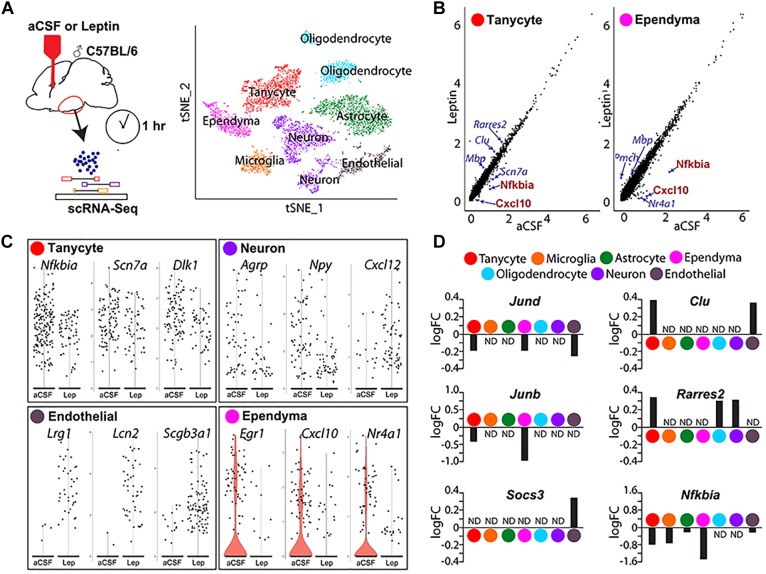
FIGURE 5.
Single-cell RNA sequencing analysis identifies differentially expressed genes in mediobasal hypothalamus following i.c.v. leptin infusion. (A) Schematic diagram describing the pipeline of generating act-Seq data (left) and 2D tSNE plot with annotated clusters (right). (B) Correlation plot showing log-normalized gene-expressions between aCSF (x-axis)- and leptin (y-axis)-infused samples in tanycytes (left) and ependymocytes (right). (C) Violin plots showing changes in gene expressions between aCSF- and leptin-infused samples in tanycytes (top left), neurons (top right), endothelial cells (bottom left), and ependymocytes (bottom right). (D) Bar graphs showing fold changes between two groups (positive fold change indicates an increased expression in leptin-infused group) in all 7 clusters.

