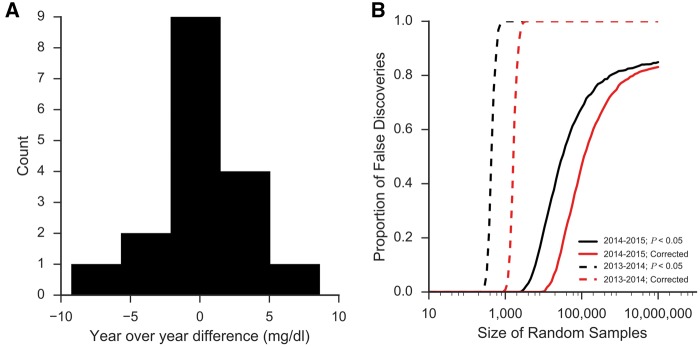
Figure 1.
The triviality of P-values. When ‘big data’ do not conform to the assumptions of statistical tests being performed on them, P-values become meaningless. (A) CUMC/NYP has run >10 million blood glucose tests over the past 15 years and over that time that year-over-year difference in the average value has barely changed (0.05 mg/dl, 0.05%). However, between some years, larger differences in average glucose are observed. Between 2013 and 2014, for example, the difference in the average glucose measurement was 9.3 mg/dl or 6%—a difference that is likely explained by slight differences in patient population or practice patterns. (B) These insignificant changes can confound analyses and produce trivially significant P-values with cohorts of ≥ 1000 showing significant differences, regardless of what is being studied. Even years with smaller differences (1.1 mg/dl between 2014 and 2015) will produce false discoveries at extremely high rates.

