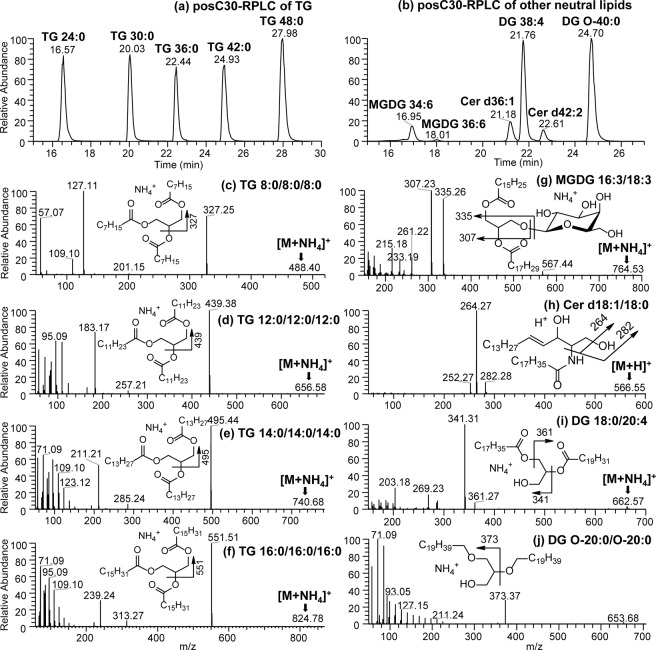
Figure 7.
C30-RPLC-MS chromatogram showing separation of neutral lipid species in positive ion mode. (a) represents TG molecular species resolved based on chain length, (b) Resolution of DG, ceramides and glycolipid molecular species. C30-RPLC-MS/MS spectra of [M + NH4]+ ions representing lipid standards: (c) TG 8:0/8:0/8:0, (d) TG 12:0/12:0/12:0, (e) TG 14:0/14:0/14:0, (f) TG 16:0/16:0/16:0, (g) MGDG 16:3/18:3, (h) Cer d18:1/18:0 [M + H]+ ion, (i) DG 18:0/20:4 and (j) DG O-20:0/O-20:0.

