Figure 4.

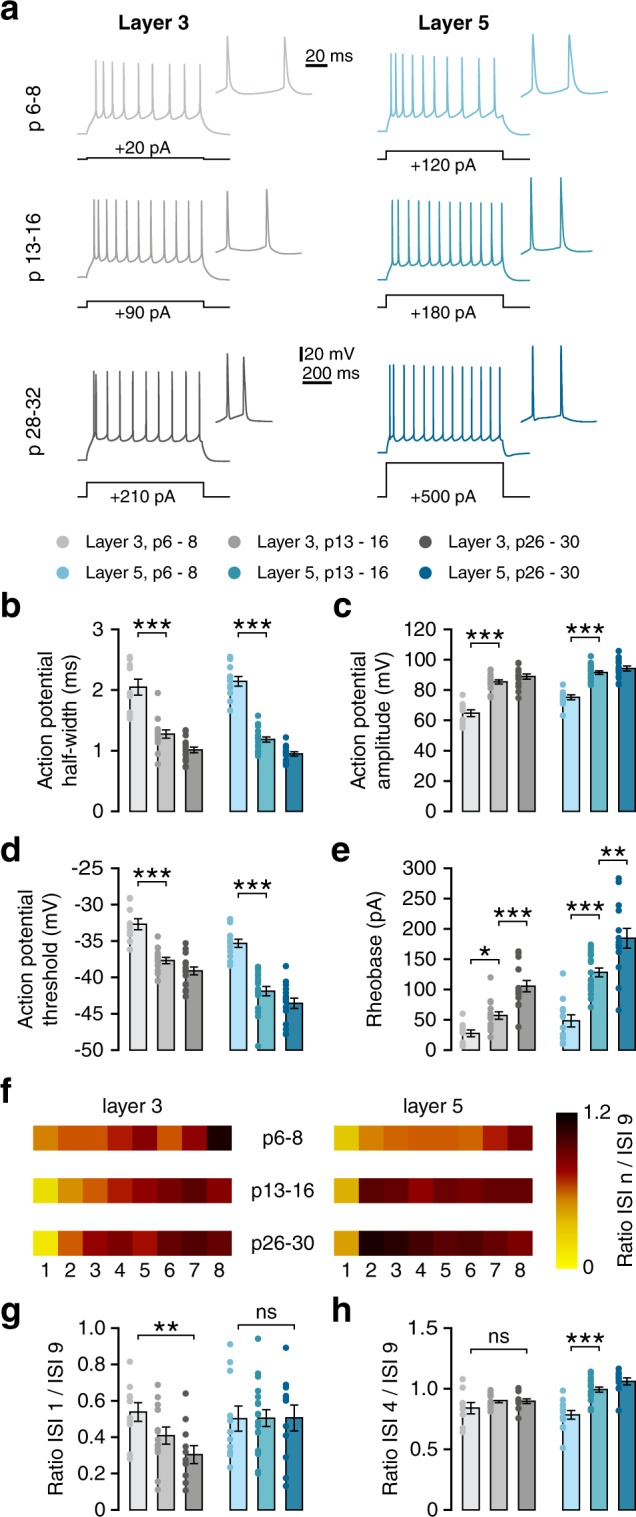
Firing properties in both cortical layers develop largely in parallel. (a) Example voltage traces in response to suprathreshold depolarising current step that elicits 10 or more action potentials. Inset: first two action potentials of the same voltage trace. Black lines indicate the amplitude of the current step that elicited the voltage response. (b) Action potential halfwidth decreases rapidly during the second postnatal week, decreasing even further afterwards (L3, Welch’s F(2,18) = 25.61, p < 0.001; post-hoc w1-w2, p = 0.001; w2 vs w4, p = 0.011; L5, F(2,42) = 124.67, p < 0.001; post-hoc w1-w2, p < 0.001; w2 vs w4, p = 0.003). (c) Action potential amplitude increases during the second postnatal week in neurons of both layers (L3, F(2,37) = 46.85, p < 0.001; post-hoc w1-w2, p < 0.001; L5, F(2,43) = 43.78, p < 0.001; post-hoc w1-w2, p < 0.001). (d) Action potential threshold becomes more hyperpolarised between weeks 1 and 2 (L3, F(2,38) = 31.36, p < 0.001; post-hoc w1-w2, p < 0.001; L5, F(2,43) = 36.87, p < 0.001; post-hoc w1-w2, p < 0.001). (e) Rheobase increases during development of neurons in both layers (L3, F(2,35) = 23.13, p < 0.001; post-hoc w1-w2, p = 0.036; w2 vs w4, p < 0.001; L5, F(2,40) = 29.74, p < 0.001; post-hoc w1-w2, p < 0.001; w2 vs w4, p = 0.003). (f) Spike frequency adaptation represented through ISI ratios. Heatmap colours represent the ratio between the 9th ISI and each of the 8 previous ISIs (numbered below). (g) ISI1/9 ratio decreases during development in L3 but not L5 neurons (L3, F(2,31) = 5.21, p = 0.011; post-hoc w1-w4, p = 0.008). (h) ISI4/9 ratio increases during development in L5 neurons (F(2,38) = 23.86, p < 0.001, post-hoc w1-w2, p < 0.001).
