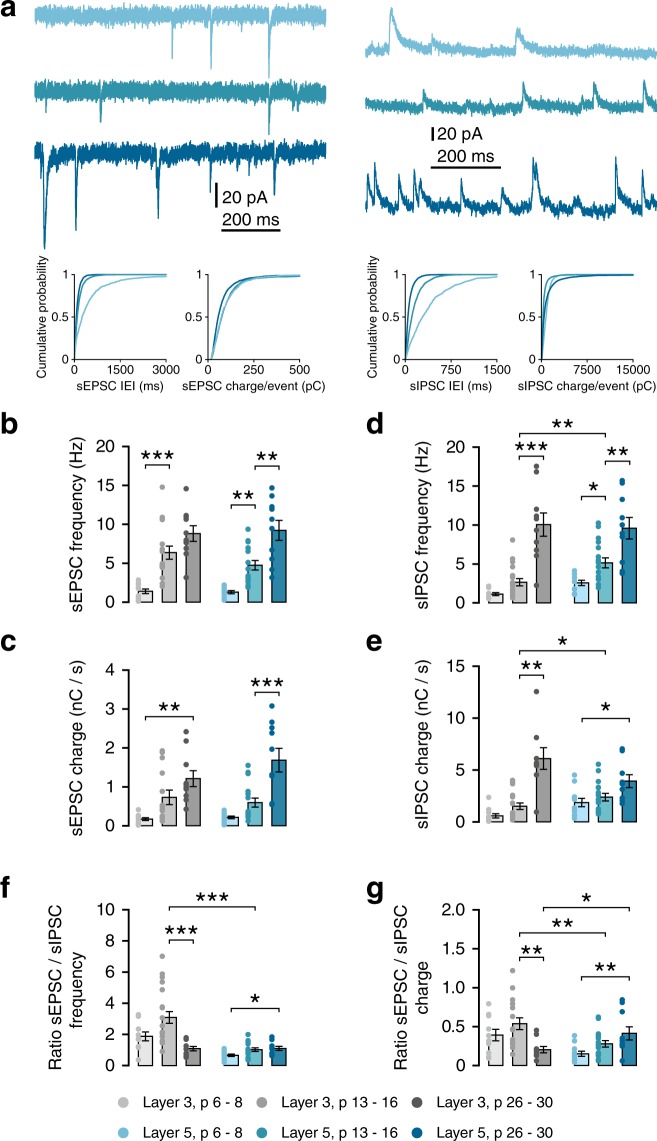
Figure 5.
Development of spontaneous synaptic transmission follows lamina-specific patterns. (a) Example traces recorded at −70 mV (left) or +10 mV (right) from L5PNs at 1, 2 and 4 weeks. Bottom panels show probability distributions for inter-event-intervals and charge-per-event for single example cells. (b) sEPSC frequency increases in L3 during the second postnatal week (Welch’s F(2,17.8) = 36.1, p < 0.001; post-hoc w1–2, p < 0.001). sEPSCs frequency in L5 increases between weeks 1 and 4 (Welch’s F(2,13.3) = 30.13, p < 0.001; post-hoc w1–2, p = 0.006; w2–4, p = 0.001). (c) sEPSC charge/second increases from week 1 to 4 in L3 (Welch’s F(2,16.3) = 15.70, p = 0.002; w1-w4, p = 0.001) and from week 2 to 4 in L5 (Welch’s F(2,16.0) = 15.49, p < 0.001; w2–4, p < 0.001). (d) sIPSC frequency increases in L3 between weeks 2 and 4 (W’s F(2,17.0) = 23.53, p < 0.001; w2–4, p < 0.001) and until week 2 in L5 (F(2,34) = 15.58, p < 0.001; w1–2, p = 0.029; w2–4, p = 0.005). L3-L5 w2, t(31) = 3.19, p = 0.003. (e) sISPCs charge/second increases in week 2 to 4 in L3 (F(2,35) = 23.80, p < 0.001; w2–4, p < 0.001), and from week 1 to 4 in L5 (W’s F(2,17.9) = 18.22, p = 0.018; w1–2, p = 0.029; w1–4, p = 0.005). L3-L5 w2, M-W U = 76, p = 0.031. (f) Ratio of sEPSC and sIPSC frequencies measured in the same cells. In L3, E/I frequency decreases between weeks 2 and 4 (K-W H(3) = 13.57, p = 0.001; w2–4, p < 0.001). In L5, E/I frequency ratio increases between weeks 1 and 4 (F(2,34) = 1.60, p = 0.033; w1–4, p = 0.047). L3 vs L5: w2, Welch’s t(19.05) = 5.167, p < 0.001; w4, t(18) = 0.07, p = 0.948. (g) Ratio of sEPSC/sIPSC charge in L3 decreases between weeks 2 and 4 (K-W H(3) = 9.92, p = 0.007; w2–4, p = 0.005). In L5 cells, there is an increase between weeks 1 and 4 (F(2,34) = 1.64, p = 0.011; w1–4, p = 0.008). L3 vs L5: w2, Welch’s t(24.84) = 3.005, p = 0.006; w4, M-W U = 21, p = 0.029.

