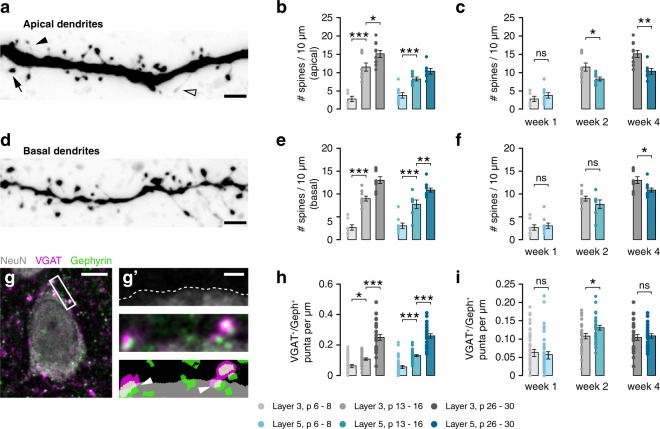
Figure 6.
Dendritic spine densities show a similar developmental pattern across layers. (a) Example image of apical dendrite of a p14 L5 cell, showing mushroom (arrow), thin (closed arrowhead) and filopodium-like spines (open arrowhead). Scale bar 2 µm. (b) Development of apical spine densities (L3, F(2,23) = 37.37, p < 0.001; post-hoc w1-w2, p < 0.001, w2-w4, p = 0.034; L5, F(2,21) = 23.53, p < 0.001; post-hoc w1-w2, p < 0.001, w2-w4, ns). (c) Within-age-group comparisons of data in b. Apical spine density is higher in L3 neurons at both 2 and 4 weeks (w1, t(14) = 0.89, p = 0.387; w2, t(15) = 2.53, p = 0.023; w4, t(15) = 3.543, p = 0.003). (d) Example image of basal dendrite of a p14 L5 cell. Scale bar 2 µm. (e) Development of basal spine densities (L3, F(2,24) = 64.36, p < 0.001; post-hoc w1-w2, p < 0.001, w2-w4, p < 0.001; L5, F(2,24) = 42.95, p < 0.001; post-hoc w1-w2, p < 0.001, w2-w4, p = 0.006). (f) Within-age-group comparisons of data in e. Basal spine density is higher in L3 only at 4 weeks (w1, M-W U = 33, p = 0.815; w2, t(14) = 1.19, p = 0.255; w4, t(19) = 2.55, p = 0.020). (g) Quantification of perisomatic inhibitory synapses. Scale bar 5 µm. (g’) shows, from top to bottom, delineation of the soma, high magnification composite fluorescence image, and mask of thresholded image. Arrowheads indicate perisomatic synapses. Scale bar 1 µm. (h) The density of perisomatic inhibitory synapses increases during development in both layers (L3, H = 56.47, p < 0.001, post-hoc w1-w2, p = 0.022, w2-w4, p < 0.001; L5, H = 64.8, p < 0.001, post-hoc w1-w2, p < 0.001, w2-w4, p < 0.001). (i) The density of inhibitory synapses is higher in L5 neurons than L3 neurons at 2 weeks (w1, M-W U = 846, p = 0.638; w2, t(56) = 2.34, p = 0.023; w4, t(50) = 0.38, p = 0.708).

