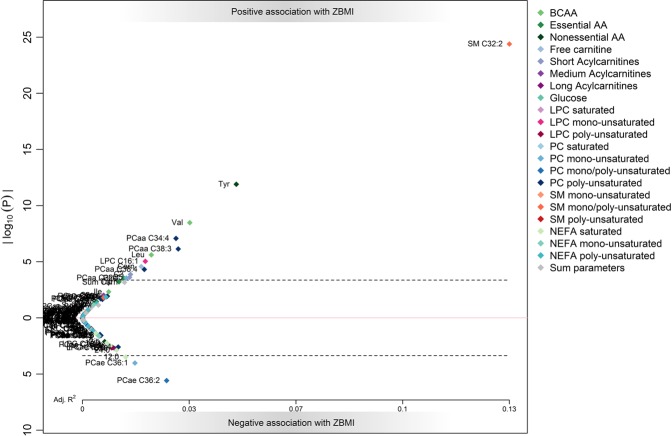
Figure 1.
Results of the individual participant meta-analysis of the association of metabolites to BMI z-score. Log transformed p-values (y-axis) are plotted against adjusted R² (x-axis), with positive associations in the upper part (above 0) and negative associations in the lower part (below 0) of the figure. The dashed line indicates the Bonferroni-corrected significance level of 0.0004. Abbreviations: AA, amino acids; BCAA, branched-chain amino acids; LPC, lyso-phosphatidylcholine; NEFA, nonesterified fatty acid; PC, phosphatidylcholine; SM, sphingomyelin.

