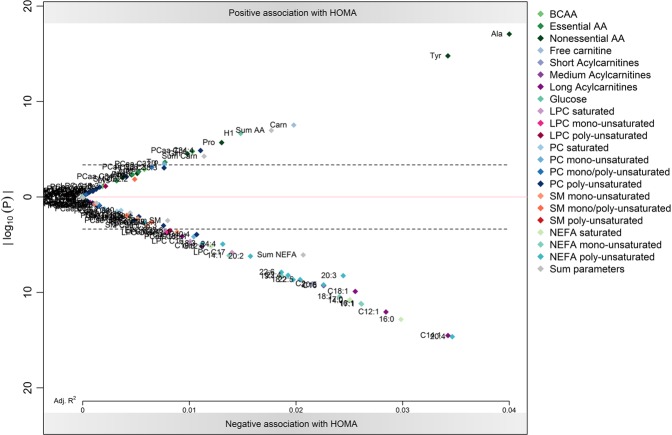
Figure 3.
Results of the individual participant meta-analysis of the association of metabolites to HOMA levels. Log transformed p-values (y-axis) are plotted against adjusted R² (x-axis), with positive associations in the upper part of the figure (above 0) and negative associations in the lower part (below 0). Regression models were adjusted for sex. The dashed line indicates the Bonferroni-corrected significance level of 0.0004. Abbreviations: AA, amino acids; BCAA, branched-chain amino acids; LPC, lyso-phosphatidylcholine; NEFA, non-esterified fatty acid; PC, phosphatidylcholine; SM, sphingomyelin.

