Fig. 1.
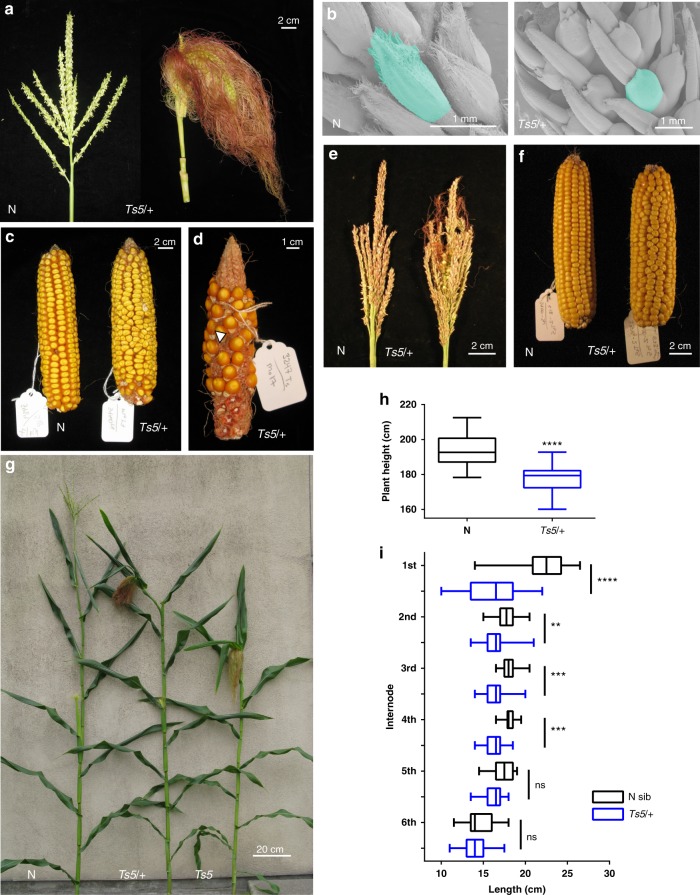
Inflorescence and vegetative phenotype of Ts5. a Normal and Ts5/ + mature tassels in Mo17. b SEM micrograph of central spike of 4 cm tassel of normal and Ts5/ + in Mo17. c Normal and Ts5/ + ears in Mo17. d A poorly pollinated Ts5/ + ear in Mo17 showing empty pericarps. Arrow: appressed empty pericarp of the lower floret. e Normal and Ts5/ + mature tassels in B73. f Normal and Ts5/ + ears in B73. g Mature plants of normal, Ts5/ + , and Ts5/Ts5 in A188. h Plant height (cm) of normal siblings (n = 30) and Ts5/ + (n = 31) in A188. Height was significantly different by two-tailed unpaired t test, P < 0.0001 (t = 6.778, df = 59; 95% CI −20.21 to −11.00). Bar, mean; whiskers, SD. i Graph of upper internode lengths of the same plants graphed in panel (h), normal siblings (n = 30) and Ts5/ + (n = 31) in A188. The entry 1st internode is measured from the last tassel branch to the first subtending node. Means of the first four internodes measured were significantly different, one-way ANOVA with Sidak’s multiple comparison test adjusted for multiple comparisons: 1st, t = 13.96, P < 0.0001, 95% CI = 4.778–7.0137; 2nd, t = 3.3874, 95% CI = 0.3131771–2.548113, P = 0.0047; 3rd, t = 4.162688, 95% CI = 0.6405964–2.875533, t = 4.287441, 95% CI = 0.6932846–2.928221, P = 0.0002; 4th, P = 0.0001, global DF = 353, ns = non-significant. Bar, mean; whiskers, SD. SEM, scanning electron microscope

