Fig. 2.
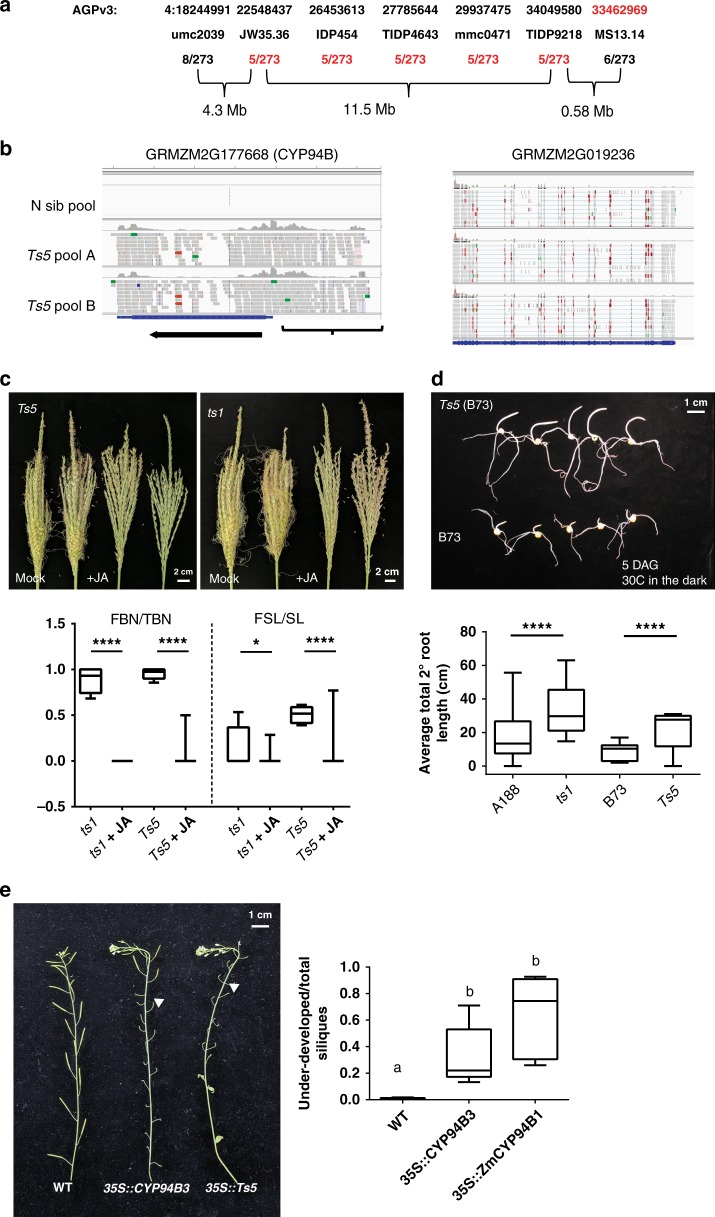
Ts5 maps to a CYP94B that catabolizes JA, is corrected by JA application, and causes under-developed siliques when overexpressed in Arabidopsis. a Schematic of the Ts5 mapping locus. Red text indicates loci lacking recombination or marker order inconsistent with B73 AGPv3. b A CYP94B (GRMZM2G177668) is upregulated in Ts5/ + tassels relative to normal siblings in the Mo17 background visualized in IGV. Ectopic 5′ reads are indicated by brackets. A linked gene (GRMZM2G019236) has similar read counts in each pool. c Mature tassel phenotypes after the exogenous application of JA to developing tassels. Graphs of the ratios of feminized branch number to total branch number (FBN/TBN) and feminized spike length to total spike length (FSL/SL) of ts1 (n = 11), ts1 + JA (n = 8), Ts5 (n = 12), and Ts5 + JA (n = 11). Bar, mean, whiskers, SD. Treated mean of FBN/TBN and FSL/SL for ts1 and Ts5 are significantly less than untreated using an unpaired, one-tailed Student’s t test with Welch’s correction, ts1 FBN/TBN treated vs untreated t = 24.0708, df = 10.0000, P < 0.0001, 95% CI = −0.980591 to −0.814434; ts1 FSL/SL treated vs untreated t = 1.799 df = 15.18, P = 0.0459, 95% CI = −0.2855 to 0.02397; Ts5 FBN/TBN treated vs untreated, t = 18.8039, df = 12.4881, P < 0.0001, 95% CI = −1.01137 to −0.802148, Ts5 FSL/SL treated vs untreated, t = 5.94347, df = 12.3037, P < 0.0001, 95% CI = −0.600572 to −0.279006. d Photo of seedling phenotypes after growing in the dark for 5 days (30 °C) and graph of mean total secondary root length of ts1 in the A188 background (n = 12), A188 (n = 10), Ts5 homozygotes in the B73 background (n = 12), and B73 (n = 11). Mean root lengths of ts1 and Ts5 were significantly longer than those of wild type by two-tailed unpaired Student’s t test: for ts1, P = 0.0419, t = 2.173557, df = 20, 95% CI = 0.6021773 to 29.28449; for Ts5, P = 0.0036, t = 3.272358, df = 21, 95% CI = 4.680919 to 21.00393. e Photo of mature Arabidopsis lines Col-O, CYP94B3-OE, and ZmCYP94B1-OE showing under-developed siliques in both overexpression lines. Graph of the mean ratio of under-developed to normal siliques in each line is shown. Letters denote that wild-type plants are significantly distinct using two-tailed Student’s t test with Welch’s correction: WT vs 35S::CYP94B3, t = 3.123, P = 0.0353, 95% CI = 0.03581 –0.6044, df = 4.009; WT vs 35S::ZmCYP94B1, t = 4.538, P = 0.0105, 95% CI = 0.2446 –1.015, df = 4.005; 35S::CYP94B3 vs 35S::ZmCYP94B1, P = 0.1136. Bar, mean; whiskers, SD

