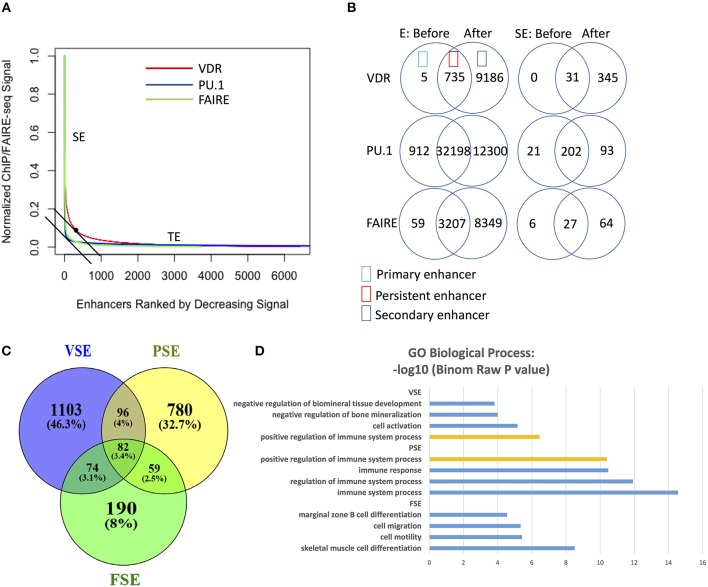
Figure 1.
VDR, PU.1, FAIRE identify different SE regions with different genes nearby and gene function enrichment, respectively. (A) The (signal density)/(density rank) curve for SE calling from VDR, PU.1 and FARIE. (B) The number of enhancers (E) and super-enhancers (SE) before and after 1,25(OH)2D3 stimulation. (C) The Venn overlap figure for the gene list near VSE, PSE and FSE in 50 kb regions. VSE, VDR SE; PSE, PU.1 SE; FSE, FAIRE SE. (D) The enrichment analysis of GO biological process gene set for VSE, PSE and FSE; orange bar: the shared process between VSE and PSE (GEO data shown in Table 1).

