Fig. 5.
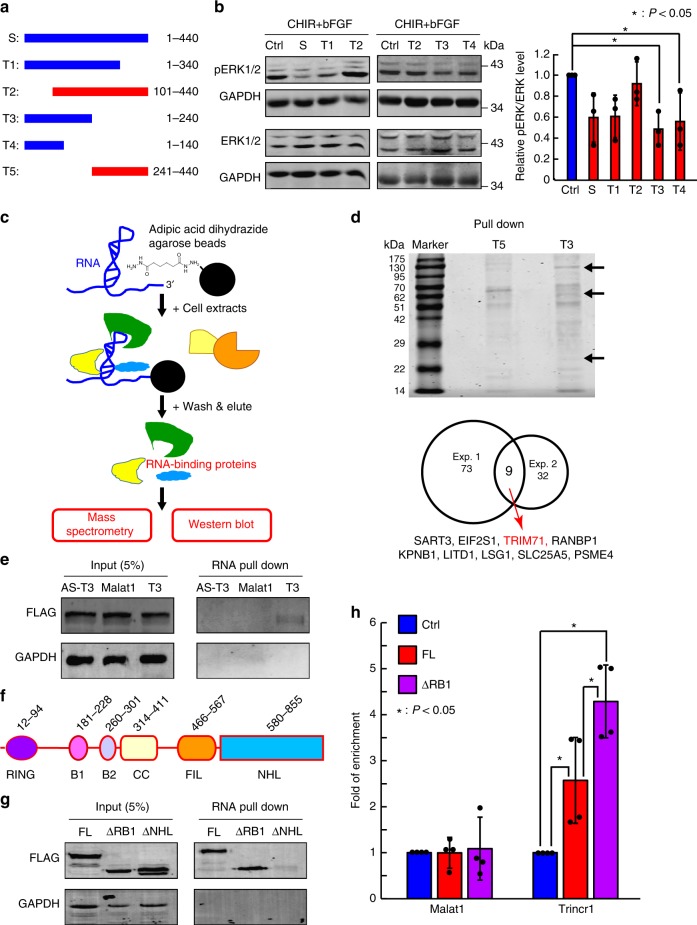
Trincr1 physically interacts with TRIM71. a Schematic design for truncated Trincr1 used in this study. Drawn in scale. Blue, RNA constructs inhibiting ERK phosphorylation; Red, RNA constructs with no effects on ERK phosphorylation. b Western blotting analysis of phosphorylated ERK in empty and Trincr1_S and Trincr1_S truncated overexpressing ESCs induced by bFGF. For quantification of pERK/ERK, data were normalized to GAPDH and then to control overexpression vector transfected ESCs cultured in CHIR and induced by 12 ng/ml bFGF. n = 3 independent experiments. c Experimental design for identifying Trincr1 interacting proteins. In vitro transcribed T3 was used as the bait, T5 was used as the control. d Trincr1 interacting proteins identified by RNA pull-down followed by mass spectrometry analysis in ESCs. Up panel shows a representative gel of RNA pull-down samples stained by Coomassie blue, and the arrow indicates the protein pulled down by T3 but not T5; Bottom panel shows the number of proteins identified by two independent pull-down experiments. e Western blotting analysis of FLAG tagged TRIM71 pulled down by in vitro transcribed antisense T3, a 200 nt fragment of the lincRNA Malat1, and T3 in ESCs. Shown is a representative gel of two independent experiments. f Graphic illustration showing different protein domains in TRIM71. g Western blotting analysis of Flag tagged full length (FL), RING /B1 domain truncated (ΔRB1), and NHL domain truncated (ΔNHL) TRIM71 pulled down by T3 in ESCs. Shown is a representative gel of two independent experiments. h RT-qPCR analysis of Trincr1 and Malat1 following Flag RIP in control, Flag-Trim71, and Flag-RING and B1 truncated Trim71 overexpressing ESCs. Data were normalized to control ESCs transfected with empty 3X FLAG overexpression vectors. n = 4 independent experiments. Shown are mean ± SD. For b, P values were determined by unpaired two-way ANOVA with one-sided Dunnett’s test. For h, P values were determined by unpaired two-way ANOVA with Tukey’s test

