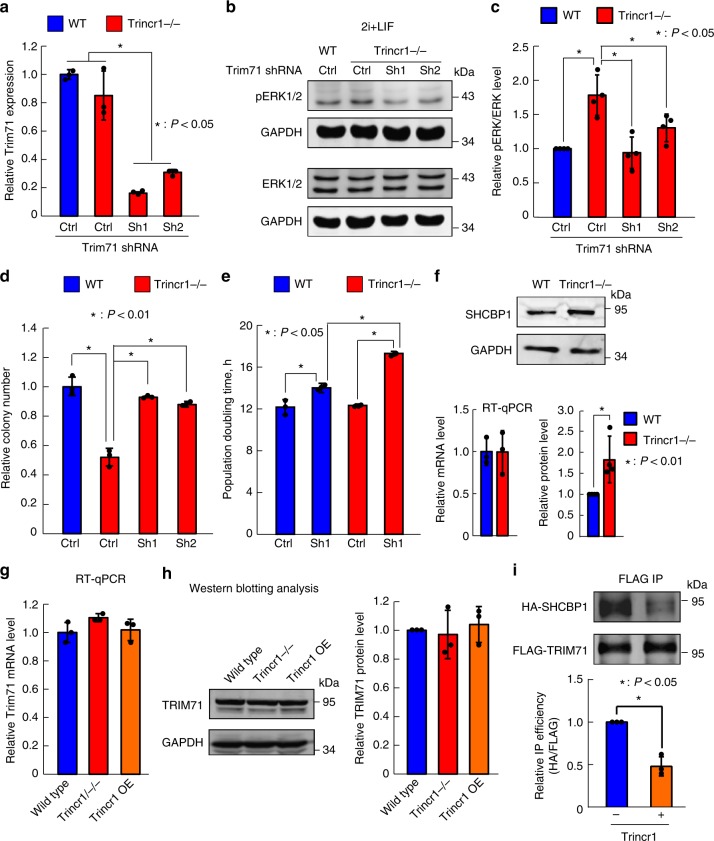
Fig. 6.
Trincr1 functions through suppressing TRIM71. a RT-qPCR analysis of Trim71 knocking down in Trincr1−/− ESCs. n = 3 biological replicates. b Western blotting analysis of pERK in control shRNA vector treated wild-type ESCs and control or Trim71 shRNA vector treated Trincr1−/− ESCs cultured in 2i + LIF. Shown are representative images. c Quantification of pERK/ERK. n = 4 independent experiments. d Colony formation assay for control or Trim71 shRNA ESCs in wild type or Trincr1−/− in PD + LIF. n = 3 biological replicates. e Population doubling time for Trincr1−/− and Trim71 knockdown ESCs in 2i + LIF medium. n = 3 biological replicates. The first two columns were the same data appeared in Supplementary figure 1e. f Western blotting analysis and qPCR of Shcbp1 in wild type and Trincr1−/− ESCs. Bottom left: quantification of western blot data, n = 4 independent experiments. Bottom right: qPCR of Shcbp1. Data were normalized to wild-type ESCs. n = 3 biological replicates. g RT-qPCR analysis of Trim71 expression in wild type, Trincr1−/−, and Trincr1_S overexpressing ESCs. Data were normalized to wild-type ESCs. n = 3 biological replicates. h Western blotting analysis of FLAG knockin TRIM71 in wild type, Trincr1−/−, and Trincr1_S overexpressing ESCs in 2i + LIF. n = 3 independent experiments. i Western blotting analysis of immunoprecipitation with FLAG antibody (FLAG IP) in HEK293 cells expressing HA-SHCBP1 and FLAG-TRIM71 with or without Trincr1_S overexpression. Shown are representative images of IP samples (left) and quantification of IP efficiency (right). IP efficiency was calculated as HA-SHCBP1 /FLAG-TRIM71 and then normalized to samples without Trincr1_S overexpression. n = 3 independent experiments. For the RT-qPCR of a, f, and g, the β-actin gene was used as a control. Shown are mean ± SD. For a, c, and d, data were normalized to wild-type ESCs treated with control shRNA vectors, P values were determined by unpaired one-way ANOVA with two-sided Dunnett’s test. For e, P-values were determined by unpaired two-way ANOVA with Tukey’s test. For f and i, P values were determined by paired two-sided Student’s t-test

