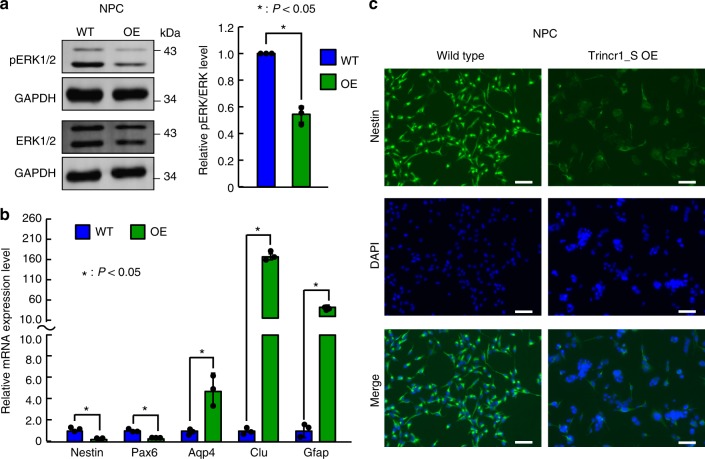
Fig. 7.
Ectopic expression of Trincr1 represses FGF/ERK signaling in NPCs. a Western blotting analysis of pERK in NPCs overexpressing Trincr1_S. Shown are representative images (left) and quantification (right). Data were normalized to ERK and then to wild-type NPCs. n = 3 independent experiments. b RT-qPCR analysis of markers for NPCs and astrocytes. The β-actin gene was used as a control. Data were normalized to the mRNA level of wild-type NPCs. n = 3 biological replicates. c Immunofluorescence of Nestin in wild type and Trincr1_S overexpressing NPCs. Green represents Nestin, Blue represents DAPI. Scale bars, 100 μm. Shown are mean ± SD. For a, P values were determined by paired two-sided Student’s t-test. For b, P-values were determined by unpaired two-sided Student’s t-test

