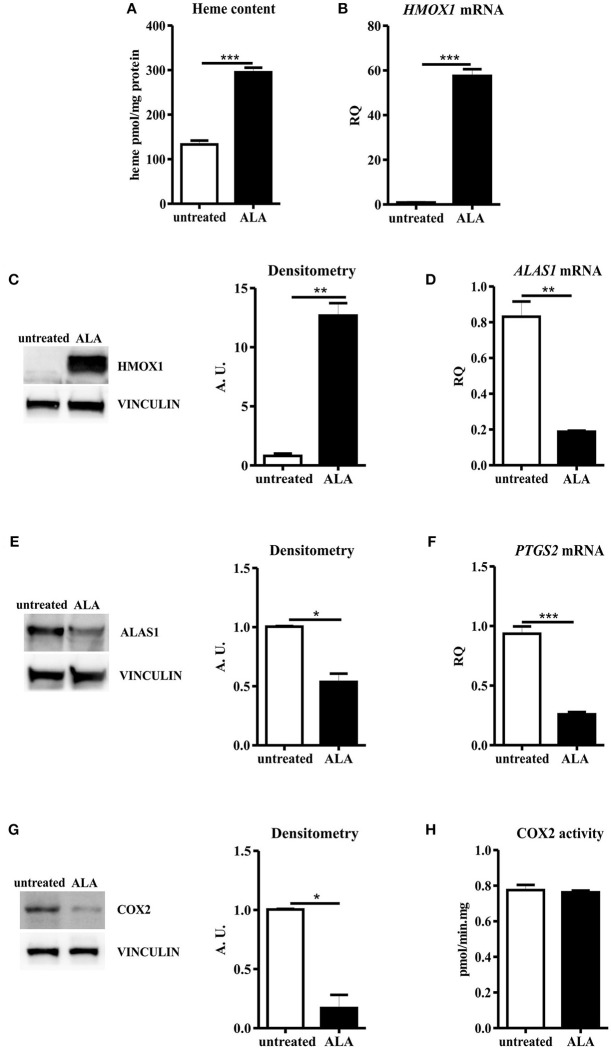
Figure 2.
ALA treatment decreased COX2 protein levels, with negligible effects on the overall enzyme activity. (A) Heme content in SNU407 cells untreated or treated with 5 mM ALA for 24 h. Values are expressed as pmol/mg protein. Data represent mean ± SEM, n = 3; ***p < 0.001. (B) qRT-PCR analysis of HMOX1 expression in SNU407 cells untreated or treated with 5 mM ALA for 24 h. Transcript abundance, normalized to beta-actin mRNA expression, is expressed as a fold increase over a calibrator sample (RQ = Relative Quantity). Data represent mean ± SEM, n = 3; ***p < 0.001. (C) Representative Western blot of HMOX1 expression in SNU407 cells untreated or treated with 5 mM ALA for 24 h. Band intensities were measured by densitometry and normalized to vinculin expression (A. U. = Arbitrary Unit). Densitometry data represent mean ± SEM, n = 2; **p < 0.01. (D) qRT-PCR analysis of ALAS1 expression in SNU407 cells untreated or treated with 5 mM ALA for 24 h. Transcript abundance, normalized to beta-actin mRNA expression, is expressed as a fold increase over a calibrator sample (RQ = Relative Quantity). Data represent mean ± SEM, n = 3; **p < 0.01. (E) Representative Western blot of ALAS1 expression in SNU407 cells untreated or treated with 5 mM ALA for 24 h. Band intensities were measured by densitometry and normalized to vinculin expression (A. U. = arbitrary unit). Densitometry data represent mean ± SEM, n = 2; *p < 0.05. (F) qRT-PCR analysis of PTGS2 expression in SNU407 cells untreated or treated with 5 mM ALA for 24 h. Transcript abundance, normalized to beta-actin mRNA expression, is expressed as a fold increase over a calibrator sample (RQ = Relative Quantity). Data represent mean ± SEM, n = 3; ***p < 0.001. (G) Representative Western blot of COX2 expression in SNU407 cells untreated or treated with 5 mM ALA for 24 h. Band intensities were measured by densitometry and normalized to vinculin expression (A. U. = arbitrary unit). Densitometry data represent mean ± SEM, n = 2; *p < 0.05. (H) COX2 activity in SNU407 cells untreated or treated with 5 mM ALA for 24 h. Values are expressed as pmol/min.mg protein. Data represent mean ± SEM, n = 4.

