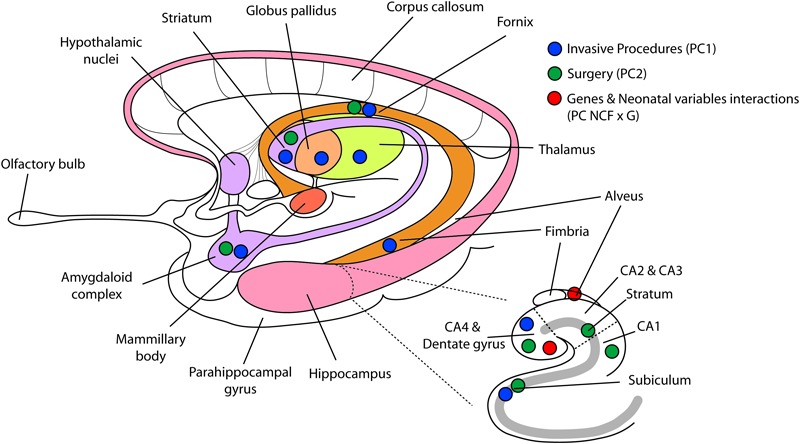
FIGURE 1.

Reduced regional volumes in limbic system, basal ganglia, and thalamus. This figure displays the results of the constrained principal component analysis. Blue dots representing number of invasive procedures (component 1) are displayed on the brain regions that were significantly altered. Green dots representing more surgeries (component 2) are displayed on brain regions that were bilaterally reduced by the number of neonatal surgeries. Red dots, representing the interaction term between neonatal clinical factors and genotypes, show the two brain regions significantly related to this interaction term. PC1, principal component 1; PC2, principal component 2; PC NCFxG, principal component of the interaction term between neonatal clinical factors and genotypes.
