Figure 1.
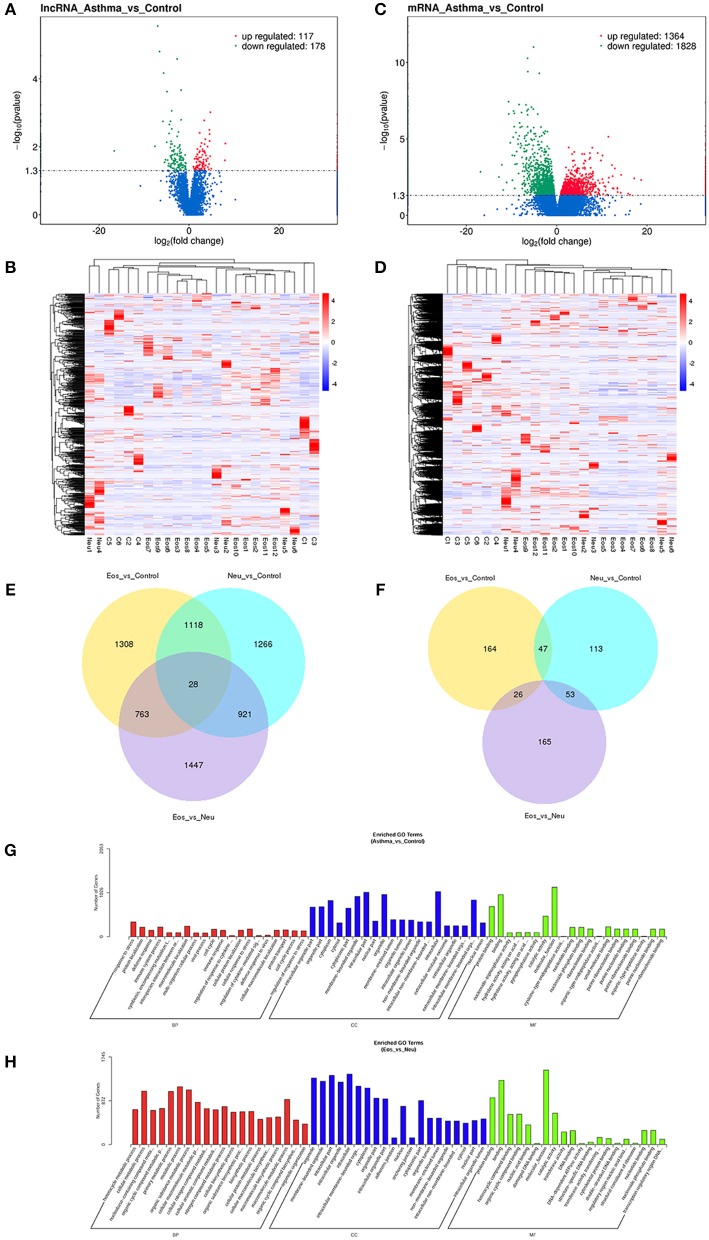
(A) Volcano plot assessment of lncRNA expression between asthma and control groups. Red spots indicate a >2.0-fold change in lncRNA expression between asthma and control groups. Green spots indicate a <0.5-fold change between asthma and control groups. (B) Heat map analysis of differentially expressed lncRNAs between asthma and control group. Blue indicates low lncRNA expression and red indicates high lncRNA expression. (C) Volcano plot assessment of mRNA expression between asthma and control groups. Red spots indicate a >2.0-fold change in mRNA expression between asthma and control groups. Green spots indicate a <0.5-fold change between asthma and control groups. (D) Heat map analysis of differentially expressed mRNAs between asthma and control group. Blue indicates low lncRNA expression and red indicates high lncRNA expression. (E) Venn diagram showing differential expression of mRNAs between asthma and control groups. (F) Venn diagram showing differential expression of lncRNA between asthma and control groups. (G) Gene Ontology (GO) analysis of differentially expressed lncRNAs between asthma and control groups. The most enriched GO terms targeted by dysregulated transcripts were involved in a variety of functions, such as immune response, immune system process, cellular response to stress, and response to stress. (H) Gene Ontology (GO) analysis of differentially expressed lncRNAs between Eos and Neu groups. The enriched GO term targeted by dysregulated transcripts was involved in multiple metabolic processes.

