Figure 3.
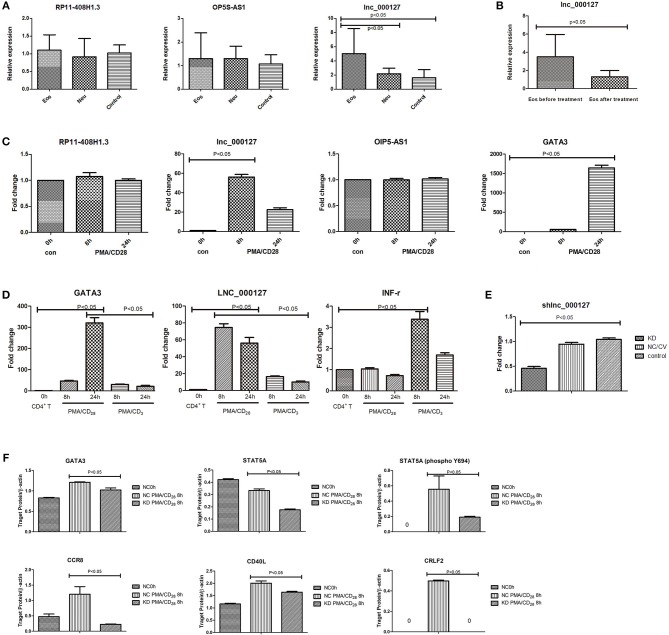
(A) Three selected lncRNA expression levels were validated in vivo. The expression of the selected three lncRNAs was validated by qPCR in three groups in vivo. LNC_000127 was upregulated in Eos samples (p < 0.05). (B) Before and after treatment, the expression of LNC_000127 was validated by qPCR in Eos samples in vivo. LNC_000127 was downregulated after treatment in Eos samples (p < 0.05). (C) lncRNA expression in response to PMA/CD28 stimulation. Jurkat cells were treated without (control) or with 10 ng/mL PMA, and 1 μg/mL CD28 for 8 and 24 h. Levels of selected lncRNAs and GATA3 were determined by qPCR, using the housekeeping gene GAPDH as a reference. Data are shown as the mean ± SD (n = 3) and are representative of one of three independent experiments. p < 0.05 compared to the control group, as analyzed by one-way ANOVA and post-hoc Bonferroni test. (D) Human CD4+ T cells were divided into three groups. One group was treated with 10 ng/mL PMA, and 1 μg/mL CD28 for 8 and 24 h. One group was treated with 10 ng/mL PMA, and 1 μg/mL CD3 for 8 and 24 h. The last group was used as a control. Gene expression results were validated by qPCR. Levels of selected genes (GATA3, LNC_000127, and INF-r) were determined by real-time PCR using the housekeeping gene GAPDH as a reference. Data are shown as the mean ± SD (n = 3) and are representative of one of three independent experiments. A p-value <0.05 compared to the control group, as analyzed by one-way ANOVA and post-hoc Bonferroni test. (E) Expression of LNC_000127 was validated by qPCR. Data are shown as the mean ± SD (n = 3) and are representative of one of three independent experiments. p-Value <0.05 compared to the control group, as analyzed by one-way ANOVA and post-hoc Bonferroni test. (F) Expression of the genes was validated by western blotting. Gene expression in response to PMA/CD28 stimulation. Jurkat cells were treated without (control) or with 10 ng/mL PMA, and 1 μg/mL CD28 for 8 h. β-Actin was used as a reference. The relative abundance of genes was calculated as the ratio of the normalized densitometric values between three samples. Intergroup differences (of the densitometry data) were calculated by the Mann-Whitney U test using SPSS version 11.6 software. p-Value <0.05 was considered to indicate a statistically significant difference.

