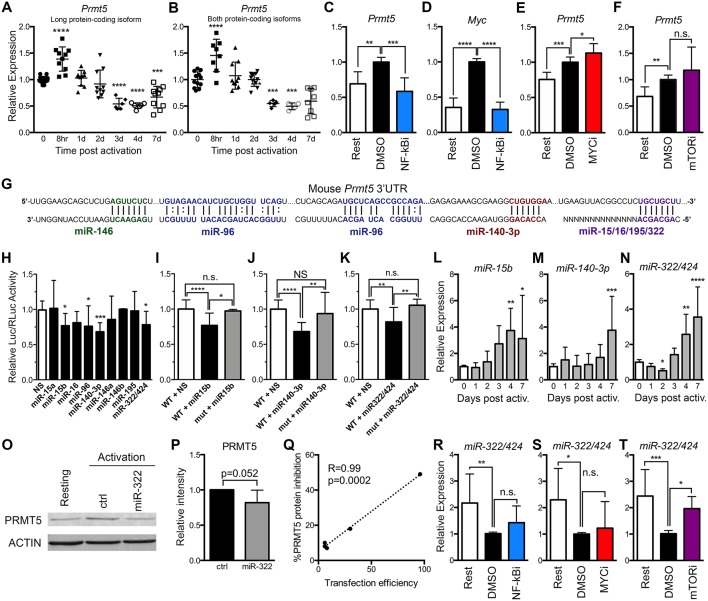
Figure 2.
PRMT5 protein induction is regulated transcriptionally and post-transcriptionally in murine naive Th cells. (A,B) Murine naive Th cells were isolated from B10.PL mice, activated with anti-CD3/CD28 and analyzed by real time PCR for Prmt5 transcripts (exon 12–13) that yield the long PRMT5 protein isoform (A) or transcripts (exon 7–8) that can yield both the long or short PRMT5 protein isoform (B) at the indicated time-points. (C–E) Isolated naive Th cells were activated for 8 h and treated with NF-κB inhibitor Bay11-7082 (NF-κBi) (C–D), MYC inhibitor 10058-F4 (MYCi) (E), or mTOR inhibitor rapamycin (F), and Prmt5 (C,E,F) or Myc (D) mRNA were measured by real time PCR. (G) Mouse Prmt5 3′UTR and Targetscan or RNA22-predicted miRNA-binding sites. The miRNA sequence is shown below the Prmt5 mRNA sequence (straight lines indicate a Watson-Crick base pairing between mRNA and miRNA nucleotides and dotted lines indicate wobble base pairing). Bolded nucleotides indicate the seed sequence of the miRNAs. (H) Cos-7 cells were transfected with pmiRGlo Dual Glo Luciferase plasmid containing mouse Prmt5 3′UTR and transfected with nonsense (NS) miRNA, miR-15a, miR-15b, miR-16, miR-140-3-p, miR-146a, miR-146b, miR-195, or miR-322/424. Firefly luciferase expression was normalized to Renilla luciferase expression. (I–K) Cos-7 cells were transfected with pmiRGlo Dual Glo Luciferase plasmid containing mouse wild-type or mutated Prmt5 3′UTR and the indicated miRNAs: miR-15b (I), miR-140-3p (J), or miR-322/424 (K). The binding sites mutated in plasmids used in (I–K) are indicated in Materials and Methods section. For (H–K), data are pooled from 3 independent experiments per miRNA tested. One-way ANOVA, followed by Dunnett's multiple correction test. (L) miR-15b, (M) miR-140-3p and (N) miR-322/424 expression was analyzed by real time PCR. Data are pooled from five independent experiments (n = 10). (O–Q) Isolated naive T cells were activated and transfected with a control or miR-322/424 miRNA mimic and PRMT5 and ACTIN protein expression was analyzed by Western blot (O), and quantified by ImageStudio (P), t-test p = 0.052, in five independent experiments. (Q) Pearson correlation analysis between the levels of transfection efficiency, measured by a Cy3-conjugated miRNA mimic, and level of PRMT5 suppression. (R–T) Isolated naive T cells were activated for 24 h, treated with NF-κBi (R), MYCi (S), or mTORi (T), and miR-322/424 expression was analyzed by real time PCR. One-way ANOVA, followed by Dunnett's multiple correction test. *p < 0.05, **p < 0.01, ***p < 0.001, ****p < 0.0001.

