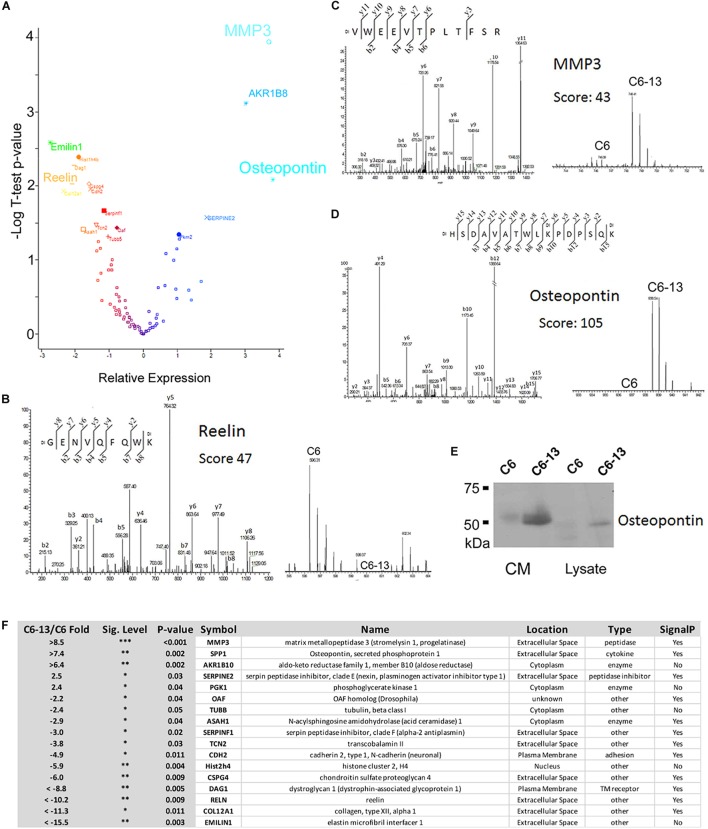
FIGURE 3.
Secretome analysis identifies differentially expressed proteins. (A) Volcano plot of secretome proteins (T-test P-value, and log2 ratio) to identify differential expression. These proteins include reelin, MMP3 and osteopontin. Select MS/MS and MS spectra: (B) Reelin; (C) MMP3; and (D) Osteopontin showing identity and differential increases with C6/C6-13. (E) SDS-PAGE/Western blot of lysates and conditioned media (CM) supports increases in osteopontin in C6-13. (F) Table summarizing proteins found to be differentially expressed: fold-change ratio, P-value, anticipated cellular location, function/enzyme type and presence of a protein secretion signal.

