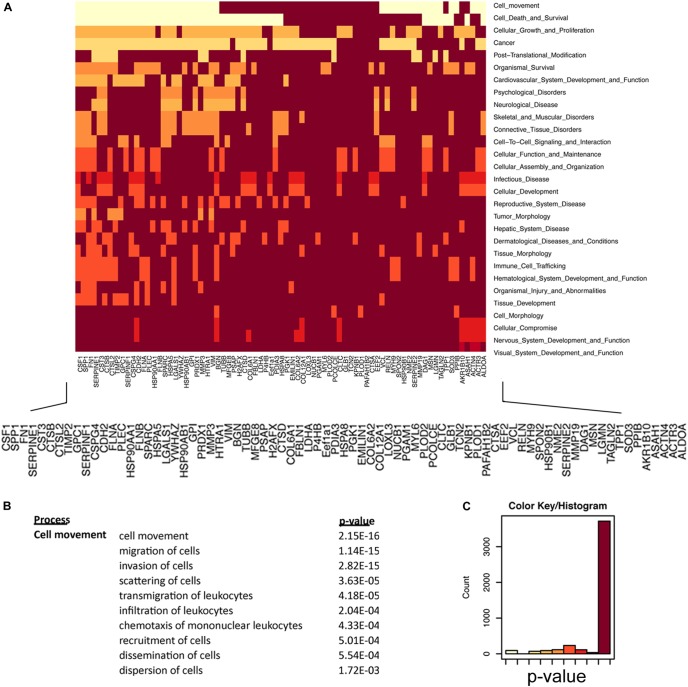
FIGURE 6.
Regulators of cellular movement are significantly enriched in glioma secretome. (A) Heat map representation of secretome proteins and functional relationships. Lighter colors in this heat map group proteins that are statistically enriched for the listed cell function (y-axis). Protein network enrichment and statistical significance were determined by Ingenuity PathwaysTM. (B) Cell Movement (P = 2.15 × 10⁻¹⁶) was the most statistically significant network encoded by the secretome of C6/C6-13 cells. Migration subnetworks (and P-values) comprising the Cellular Movement category. (C) Color bin histogram representing the distribution of both significant (x-axis: left, light) and non-significant (right, dark) protein networks represented in Figure 6A.

