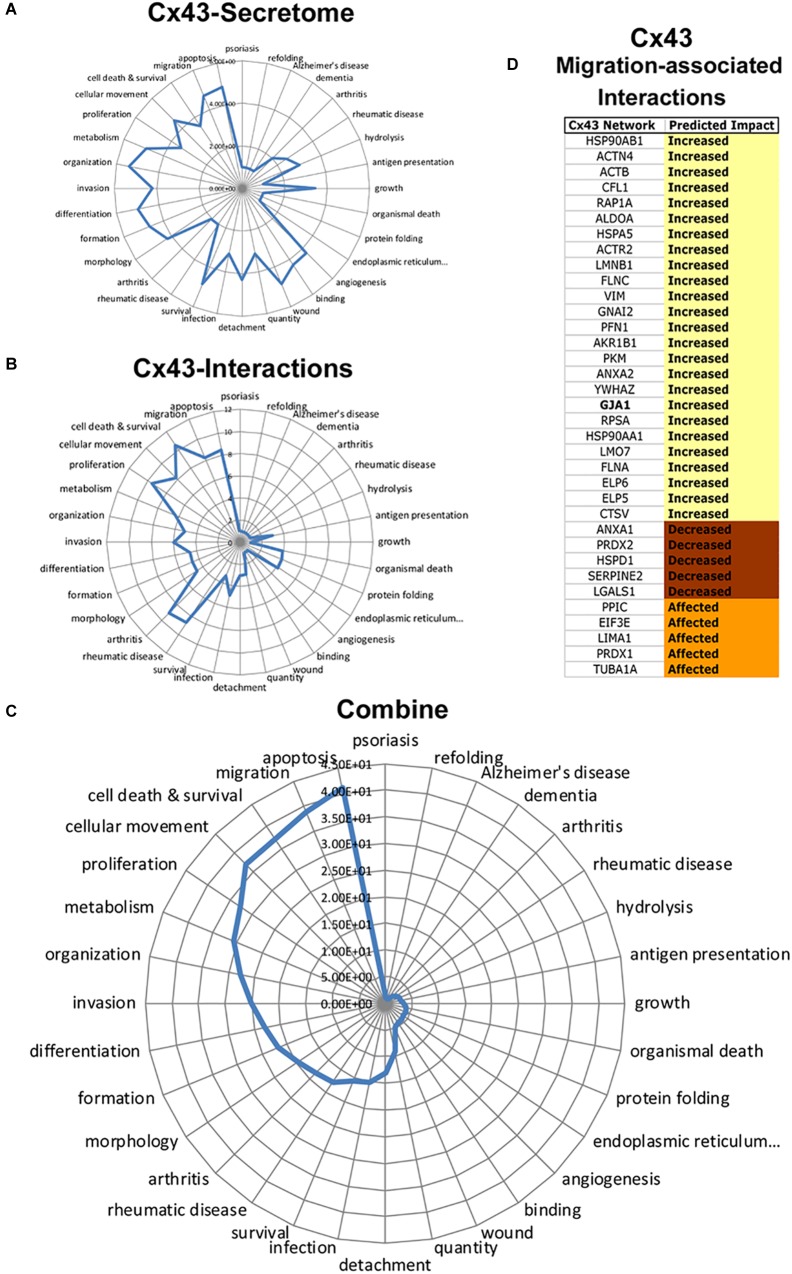
FIGURE 7.
Integrated analysis of Cx43 secretome and Cx43 protein–protein interactions reveals synergistic networks. Radar plots of pathways associated with the Cx43 (A) secretome, and (B) interactome plotted as -log P-value. C) Analysis of Cx43 networks demonstrates the coherence of “Apoptosis,” “Migration,” “Cell Death and Survival,” “Cellular Movement,” and “Proliferation” between Cx43-protein interactions and secretome. (D) Downstream impact analysis (IPA) identifies interactions of Cx43 implicated with migration. Based on IPA informatics (Activation Z-Score) the majority of these interactions are expected to increase migration.

