
FIGURE 1.
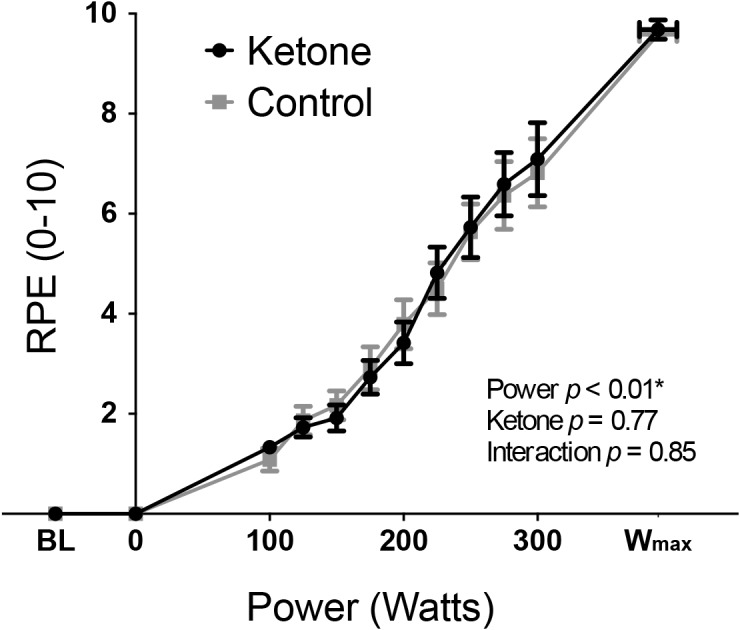
Rate of perceived exertion (RPE: mean ± SEM) plotted against power during incremental exercise under ketosis or placebo control conditions. p-values represent analysis of variance (ANOVA) results for power, ketone ester intervention and an interaction effect. Statistical significance (denoted by ∗) was taken at p < 0.05. BL = baseline.