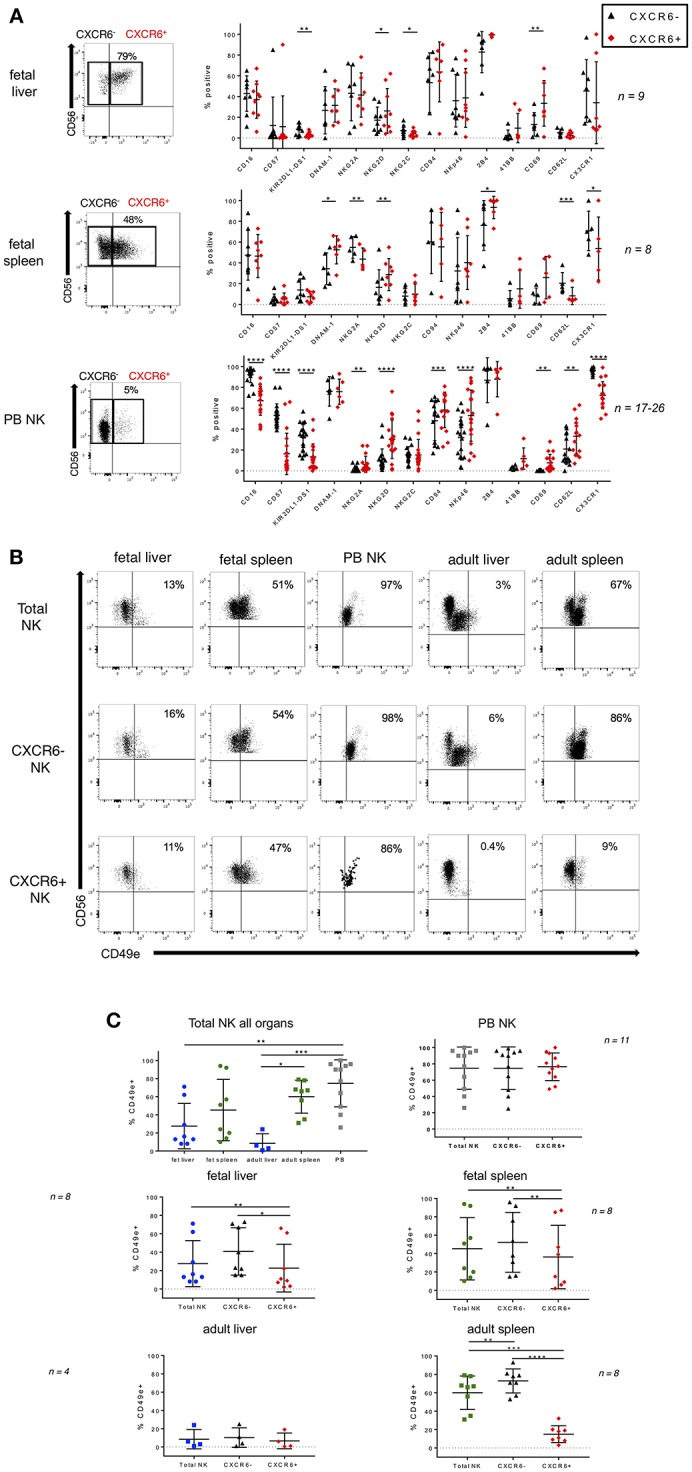
Figure 2.

Phenotypic differences in CXCR6− and CXCR6+ NK cell subsets in fetal liver and spleen. (A) Representative dot plots for gating CXCR6− and + NK cells are shown. Comparison of NK cell markers on CXCR6− (black) and CXCR6+ (red) NK cells in fetal liver, spleen, and adult PB NK cells (n = 8–26). (B) Representative flow plots showing expression of CD49e in fetal liver and spleen, adult liver and spleen, and adult PB NK cells in total, CXCR6−, and CXCR6+ NK cell subsets. (C) CXCR6+ NK cells express lower levels of CD49e than CXCR6− NK cells in fetal liver and spleen. Individual data points showing CD49e expression on total, CXCR6−, and CXCR6+ NK cell subsets in fetal liver (blue circles) and spleen (green circles), adult liver (blue squares) and spleen (green squares), and adult PB NK cells (gray squares) (n = 4–11). Bars represent mean and standard deviation for each marker. A one-way ANOVA with Tukey's Multiple Comparisons Test was performed for unpaired samples and a Student's t-test for paired CXCR6− and + NK cells within the same donor. P-values are as described in the legend to Figure 1.
