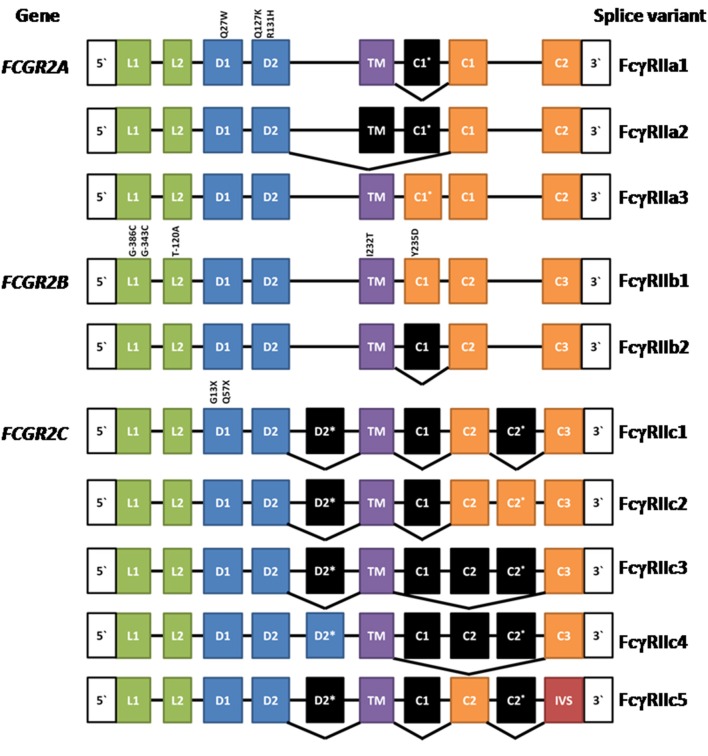
Figure 1.
Composition of FCGR2A, FCGR2B, and FCGR2C and their splice variants. Leader (L), ectodomain (D), transmembrane (TM) cytoplasmic tail (c), and intervening sequence (IVS). Expressed exons are illustrated in color, while spliced exons (selectively expressed) are represented in black. The location and position number of amino acids affected by well characterized polymorphisms are shown above the exons except for the FCGR2B leader exons where the nucleotide positions are given. See text for references.

