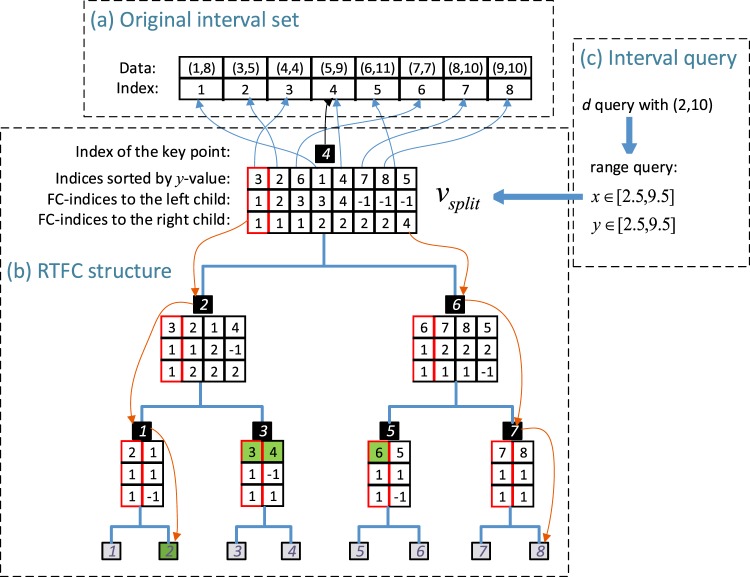
Figure 5.
An example to illustrate the construction of RTFC and the query using RTFC. (a) The original interval set and the corresponding indices. (b) The resulting tree structure and the query processes. The red arrow lines represent the search path of x1 = 2.5 and x2 = 9.5. The item bounded by a red box in a node represents the searched index in the data array for y1 = 2.5. The green shaded intervals represent the result intervals. (c) Range query transformed from interval query.

