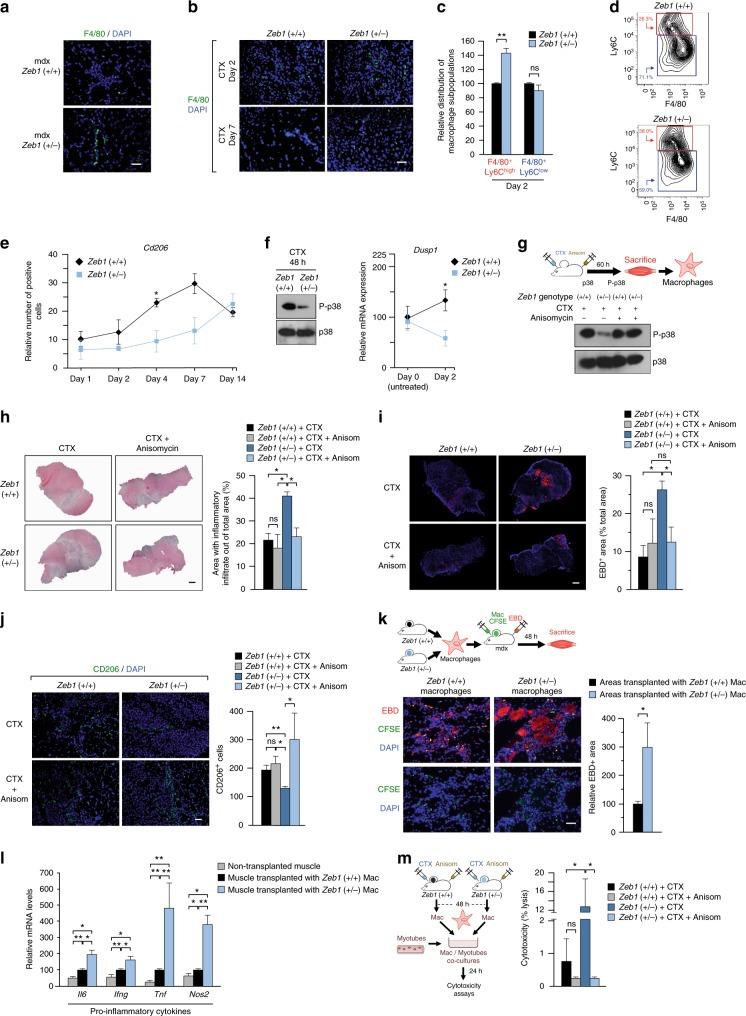
Fig. 5.
ZEB1 accelerates the p38-dependent transition of macrophages toward an anti-inflammatory phenotype and reduces their cytotoxic effect. a The gastrocnemius of mice from both genotypes were stained for F4/80 (BM8) along with DAPI. Scale bar: 50 μm. b As in a, but in wild-type and Zeb1 (+/−) muscles 2 or 7 days after CTX injection. Scale bar: 50 μm. c The gastrocnemius of wild-type and Zeb1 (+/−) mice were injected with CTX and infiltrating macrophages (CD11b+ F4/80+) were characterized for Ly6C (HK1.4) by FACS. Data are the mean of at least six mice per genotype. d Representative FACS plot for c. See Supplementary Fig. S5A for plots of other subpopulations. e Wild-type and Zeb1 (+/−) gastrocnemius were assessed for CD206/MRC1 (MR5D3) expression up to 14 days following CTX injection (see Supplementary Fig. 5D). f Left panel: Lysates from macrophages isolated from wild-type and Zeb1 (+/−) muscles 48 h after CTX injection were blotted for phosphorylated p38 (P-p38) (9211L) and total p38 (M0800). See Supplementary Fig. 5E for full unedited blots. Representative blots from three independent experiments. Right panel: Dusp1 mRNA levels in wild-type and Zeb1 (+/−) muscles before (day 0, untreated) and 2 days after CTX injection were determined by qRT-PCR. Data are the mean of at least four mice per genotype. g The gastrocnemius of wild-type and Zeb1 (+/−) mice were injected 10 μm of CTX along with 15 μg of anisomycin per gram of body weight. Sixty hours later the infiltrating macrophages were sorted out by FACS and assessed for p38 phosphorylation as in f. See Supplementary Fig. 5F for full unedited blots. h Left panel: Hematoxylin/eosin staining of the gastrocnemius of mice of both genotypes injected with CTX along with either PBS or 15 μg/g of anisomycin during 60 h. Captures are representative of four mice per genotype and condition. Scale bar: 500 μm. Right panel: Quantification of all mice as in the left panel. i Left panel: As in h, but muscle damage was assessed by EBD staining injected 9–12 h before euthanasia. Captures are representative of four mice per genotype and condition. Scale bar: 500 μm. Right panel: Quantification of EBD+ areas for all mice in the left panel. j Left panel: As in i, but muscles were examined for CD206 expression. Captures are representative of four mice per genotype and condition. Scale bar: 50 μm. See Supplementary Fig. 5G for individual staining. Right panel: Quantification of CD206+ cells for all mice in the left panel. k Macrophages from both genotypes labeled with CFSE were injected into the gastrocnemius of 6-month-old mdx;Zeb1 (+/+) mice. Nine hours before euthanasia mice were also injected with EBD to assess muscle damage. Muscles were harvested 2 days after macrophage transplant. Left panel: Representative merged pictures of at least five mice per genotype. See Supplementary Fig. 5I for individual staining captures. Scale bar: 50 μm. Right panel: Quantification of EBD+ areas associated to CSFE-labeled macrophages for all mice as in the left panel. l As in k, mdx muscles transplanted with macrophages of either genotype were analyzed for gene expression by qRT-PCR. Data are the mean of at least four mice per condition. m Left panel: Scheme of the experiment. Right panel: Macrophages isolated from wild-type and Zeb1 (+/−) gastrocnemius injected with CTX and either PBS or anisomycin were assessed for in vitro cytotoxicity on C2C12 myotubes. Macrophages originated from at least three mice per genotype and condition

