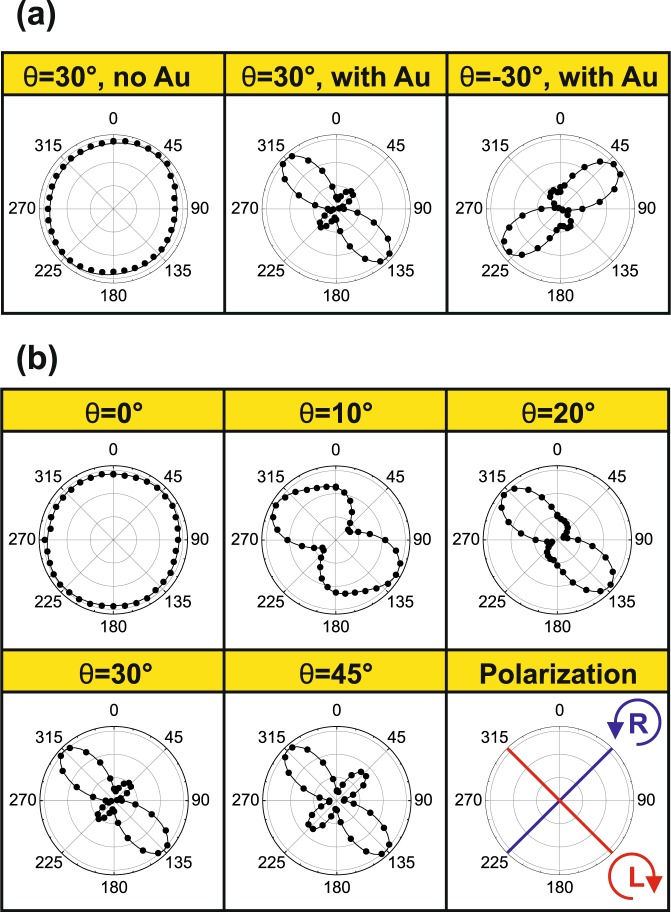
Figure 3.
Chirality of photoluminescence emission with polarized detection presented as polar plots of normalized intensity versus λ/4 waveplate angle: (a) for NWs without Au and for NWs with Au for positive and negative tilt angles (θ). (b) Different tilt angles for NWs with Au. The dots represent experimental data and the continuous lines are double sinusoidal fits. The radial scale in each plot ranges from 0.7 to 1.02. The last panel in (b) presents the WP angles corresponding the right-handed (R) and left-handed (L) polarizations.

