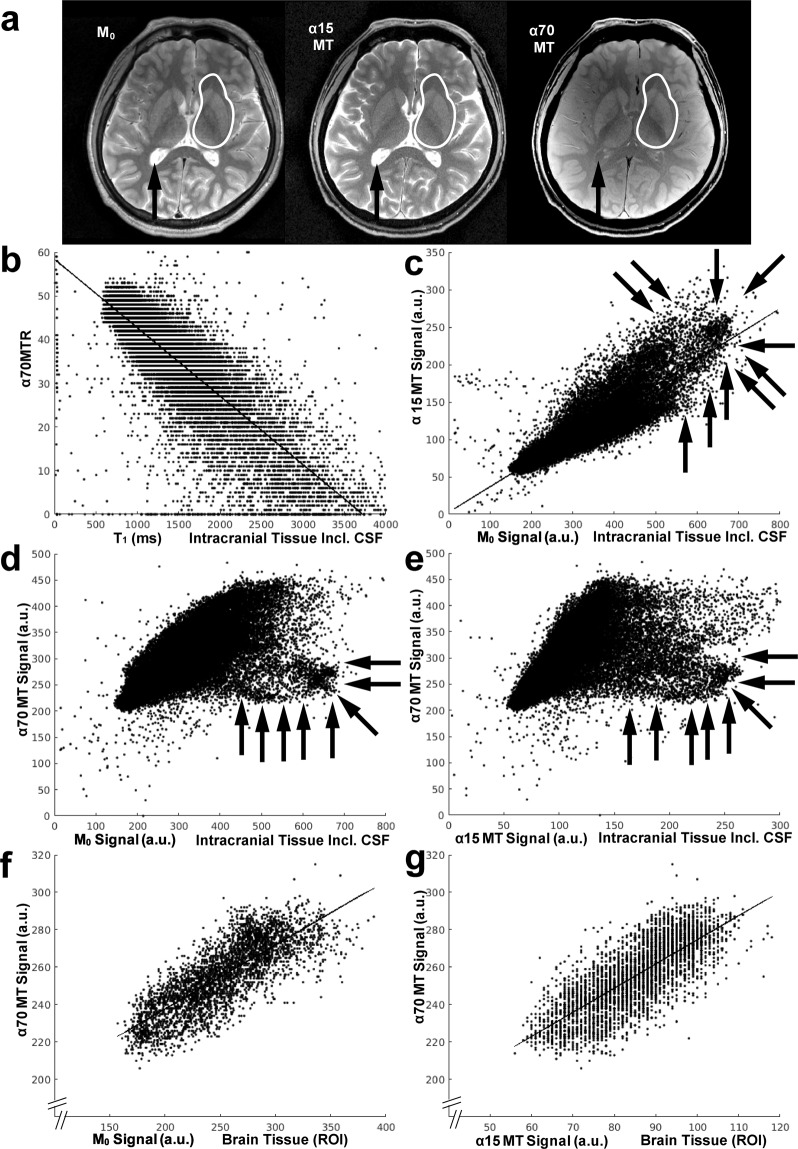
Figure 3.
Magnetization-transfer MRI provides proton-density contrast in brain while saturating extracellular free water protons. (a) Comparison of M0 map and (α15MT) proton-density-weighted as well as (α70MT) T1-weighted MRI with magnetization transfer. Note the similar contrast between M0 and α15MT for the entire intracranial tissue, the similar contrast for all three images within the regions-of-interest selected in brain (white lines), as well as the saturation of free water protons in the cerebrospinal fluid (arrows) in α70MT. (b) Pixel-by-pixel plots of α70MTR vs. T1, (c) of signal intensities in α15MT vs. M0, (d) of signal intensities in α70MT vs. M0, (e) of signal intensities in α70MT vs. α15MT for the entire intracranial tissue, (f) of signal intensities in α70MT vs. M0, and (g) of signal intensities in α70MT vs. α15MT for the regions-of-interest shown in (a). Note the significant (p < 0.0005) correlation in (b), (c), (f), and (g). A pool of pixels (arrows) with high signal intensity in M0 as well as in α15MT can be identified in (c). Strong on-resonance irradiation (d,e) results in a downward deviation of a pool of comparable size. These pixels are supposed to be dominated by free water protons. Functions and correlation coefficients are: (b) y = −0.0157x + 58.4, r = −0.84, (c) y = 0.3396x + 2.86, r = 0.87, (f) y = 0.3423x + 169.2, r = 0.80, and (g) y = 1.2925x + 145.4, r = 0.77.

